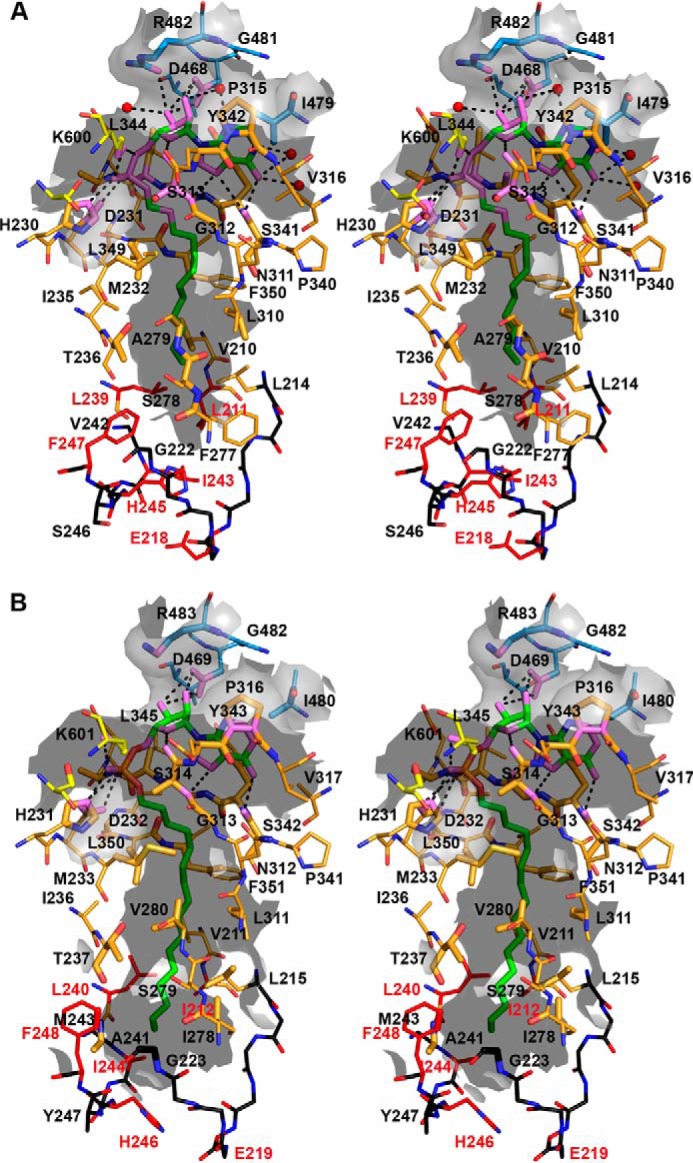
FIGURE 9.

Stereoview of the alkyl adenylate-binding site of FadD32. Residues involved in alkyl adenylate binding are represented as sticks and labeled. Atoms found within 5 Å of the ligand are shown as enlarged sticks and depict the tunnel surface, shown as the gray semitransparent surface. Protein (or ligand) atoms found within 3.5 Å of ligand (or protein) atoms are shown in violet. Polar interactions are represented by black dotted lines. The backbone atoms of segments found at the very tip of the hydrophobic tunnel are shown in black, and those of side chains involved in the closed/open state are shown in red. A, AMPC12 bound to MmFadD32 (chain A). B, AMPC20 bound to MsFadD32 (chain D). Because their side chains were not visible on the electron density map, residues Ile-212, Glu-219, and Ile-244 of MsFadD32 were truncated as alanine.
