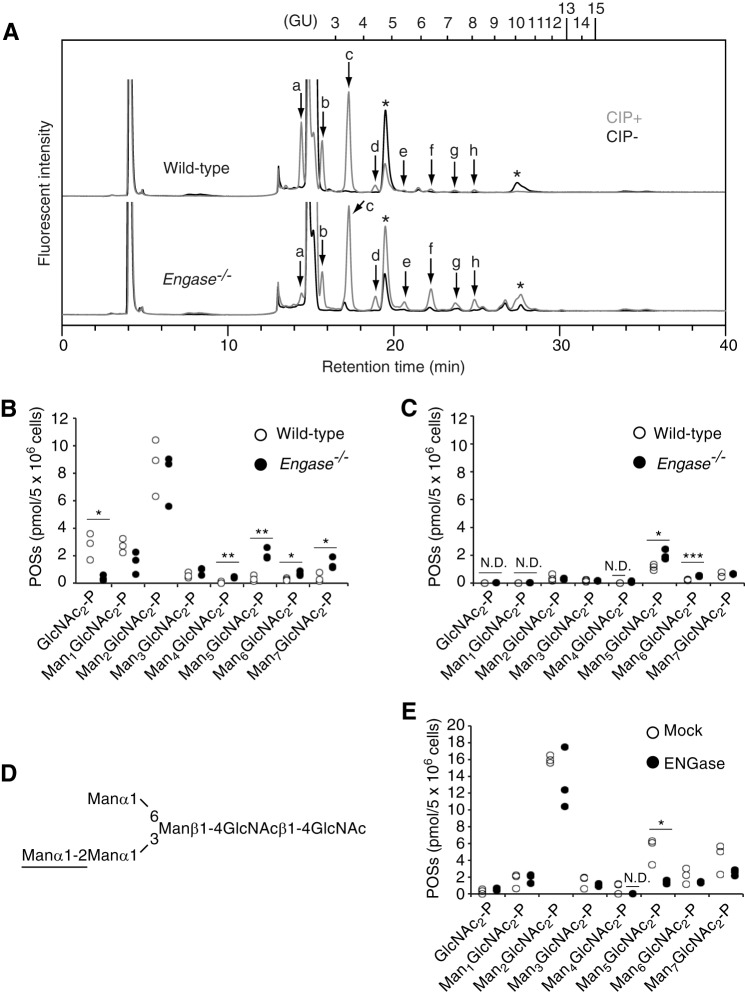
FIGURE 3.
POSs carrying a hexasaccharide accumulate in Engase−/− MEFs. A, size-fractionation HPLC of POSs obtained from glucose-deprived wild-type (top panel) and Engase−/− (bottom panel) MEFs. POSs were treated with (+) or without (−) CIP and then fluorescently labeled. Peaks a–h were detected in a CIP-dependent manner. Asterisks indicate peaks derived from labeling reagents. PA-glucose oligomers (degree of polymerization = 3–15) were used as a reference, and the glucose units (GU) were represented on the HPLC chart. B and C, quantification of POSs obtained from MEFs cultured under low glucose (B) and normal glucose (C) conditions. Three independent experiments were carried out. N.D., not detected. *, p < 0.05; **, p < 0.005; and ***, p = 0.001 (Student's t test). D, schematic representation of a hexasaccharide structure found in POSs that were increased in Engase−/− MEFs as compared with wild-type MEFs. An α1,2-linked Man residue important for the action of ENGase (32) is underlined. E, effects of ENGase overexpression in Engase−/− MEFs on POS catabolism. Three independent experiments were carried out. N.D., not detected. *, p = 0.013 (Student's t test).

