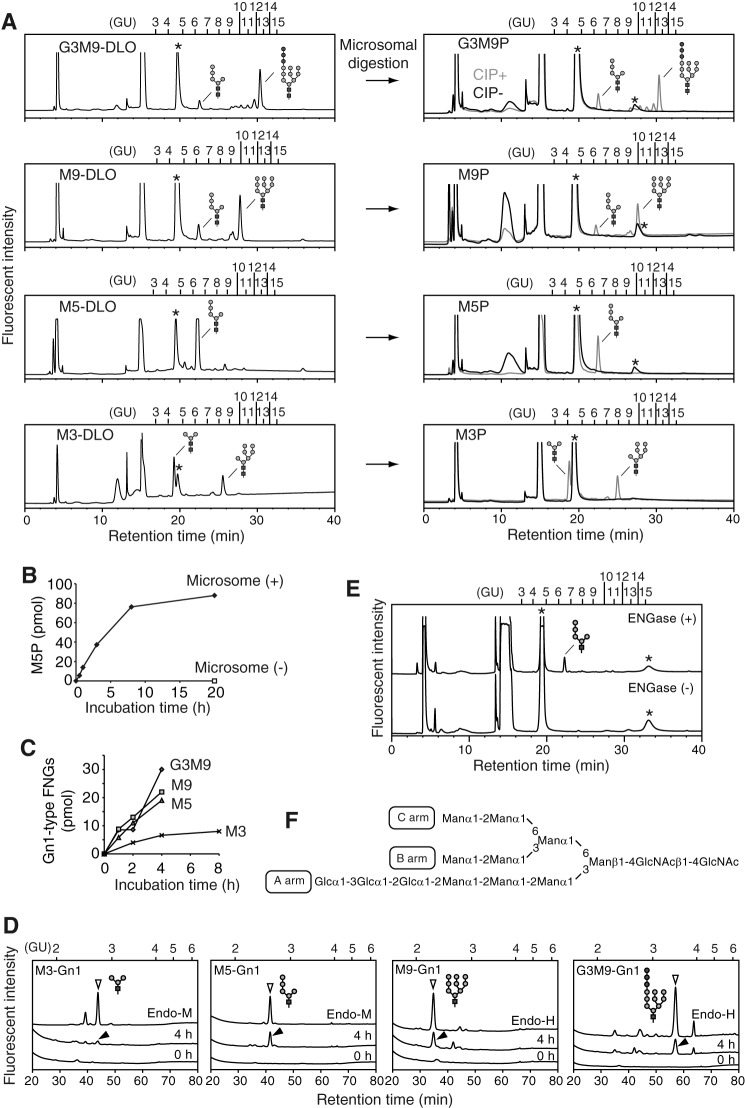
FIGURE 4.
ENGase hydrolyzes POSs in vitro. A, size-fractionation HPLC profiles of DLOs extracted from wild-type (Glc3Man9GlcNAc2-PP-dolichol; G3M9-DLO), alg6Δ (Man9GlcNAc2-PP-dolichol; M9-DLO), and alg3Δ (Man5GlcNAc2-PP-dolichol; M5-DLO) cells, which were transformed with a plasmid pRS425-GPD-ALG7 (15), and alg11Δ cells (Man3GlcNAc2-PP-dolichol; M3-DLO) (left panels). The glycan structures shown in the HPLC charts were deduced based on previously reported data (36–41) and further confirmed by the product analyses in the ENGase assay (Table 3). The DLOs were digested with mouse liver microsomes (microsomal digestion) to obtain POSs (G3M9P, M9P, M5P, and M3P, right panels). The resulting POSs were treated with (+) or without (−) CIP before fluorescent labeling. B, time course analysis of the DLO-pyrophosphatase assay in the presence (+) or absence (−) of microsomes using M5P as a substrate. C, time course analyses of the ENGase assay using M3P, M5P, M9P. and G3M9P as substrates. The amounts of Gn1-type FNGs were quantitated by size-fractionation HPLC. D, product analyses for the ENGase assay by dual-gradient reversed-phase HPLC. White arrowheads indicate the elution positions of authentic Gn1-type FNGs generated by Endo-H or Endo-M digestion of POSs. Black arrowheads indicate peaks that are generated by ENGase and co-eluted with the authentic standard glycans. Unassigned peaks generated by endoglycosidase digestions are probably derived from POSs that were co-purified with G3M9P, M9P, M5P, and M3P (see also A, right panels). E, ENGase assay using M5P as a substrate and the cytosolic fraction obtained from either ENGase-transfected (+) or non-transfected (−) Ngly1−/− Engase−/− MEFs as an enzyme source. The reaction mixtures were analyzed by size-fractionation HPLC. F, schematic representation of Glc3Man9GlcNAc2 glycan. The position of the A, B, and C arms of the glycan are indicated. Asterisks in A and E indicate peaks derived from labeling reagents. PA-glucose oligomers (degree of polymerization = 3–15) was used as a reference, and the glucose units (GU) are represented on the HPLC chart.

