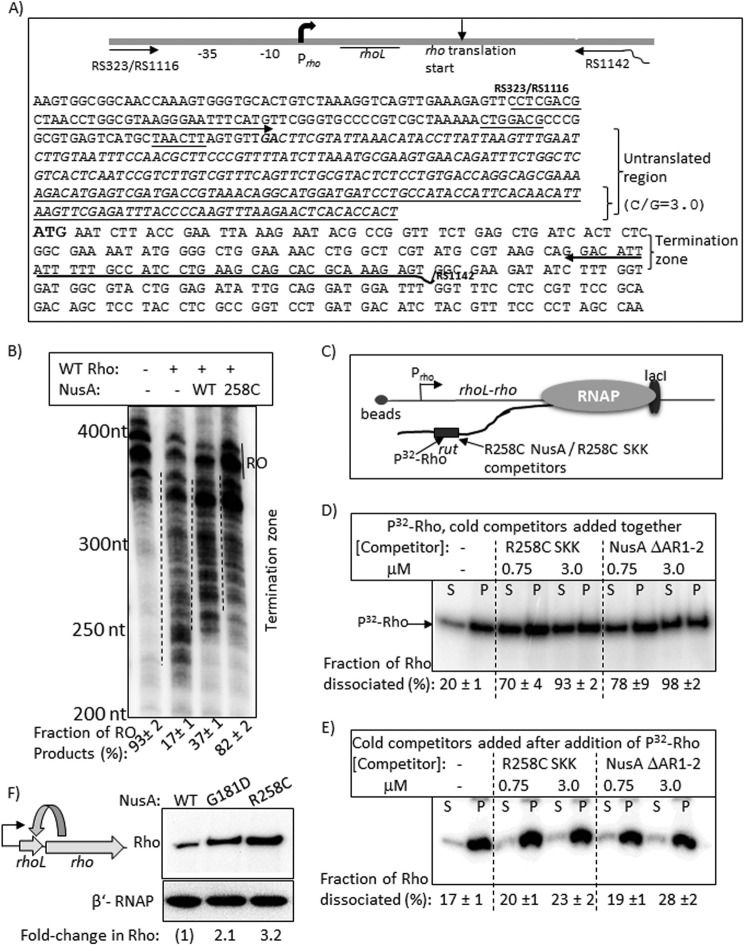
FIGURE 10.
Rho-NusA competition at the leader region of the rho operon. A, schematic showing the organization and the relevant sequences of the rho operon. Oligonucleotides RS323, RS1116, and RS1142 (also see Table 1) were used to amplify the DNA template, used in transcription assays, from the genomic DNA. Untranslated region is shown in italic type, and the underlined portion within this has a high G/C ratio of 3. The boldface GA sequence is the possible transcription start site, whereas the boldface ATG is the translation start site. B, autoradiogram showing the in vitro transcription assays on the above template under different conditions. The termination zones are indicated by dashed lines together with the amount of RO products. RNA length markers are shown on the left of the gel. C, schematic showing the stalled EC in the termination zone using LacI as a roadblock. Lac operator sequence was introduced at the end of the template using RS1142 having the operator site, and the site is 135 bp downstream of the translation start site of rho. Competition between Rho and NusA fragments for the overlapping binding site(s) in the untranslated region is indicated. D and E, autoradiograms showing the distribution of radiolabeled Rho in different fractions (half of the supernatant (S) or pellet plus the rest of the supernatant, denoted as P) upon challenge by the indicated competitors. Competitors were added together with Rho in D and after the addition of Rho in E. Fractions ([2S]/([S] + [S + P])) of dissociated Rho are indicated below the lanes. S.D. values (error bars) were obtained from 2–3 experiments. F, left, a schematic depicting the feedback regulation in the rho operon. Right, Western blot to estimate the amount of in vivo concentrations of Rho in the presence of WT and mutant NusA. The blot for the β′-subunit of RNAP is used as a loading control.

