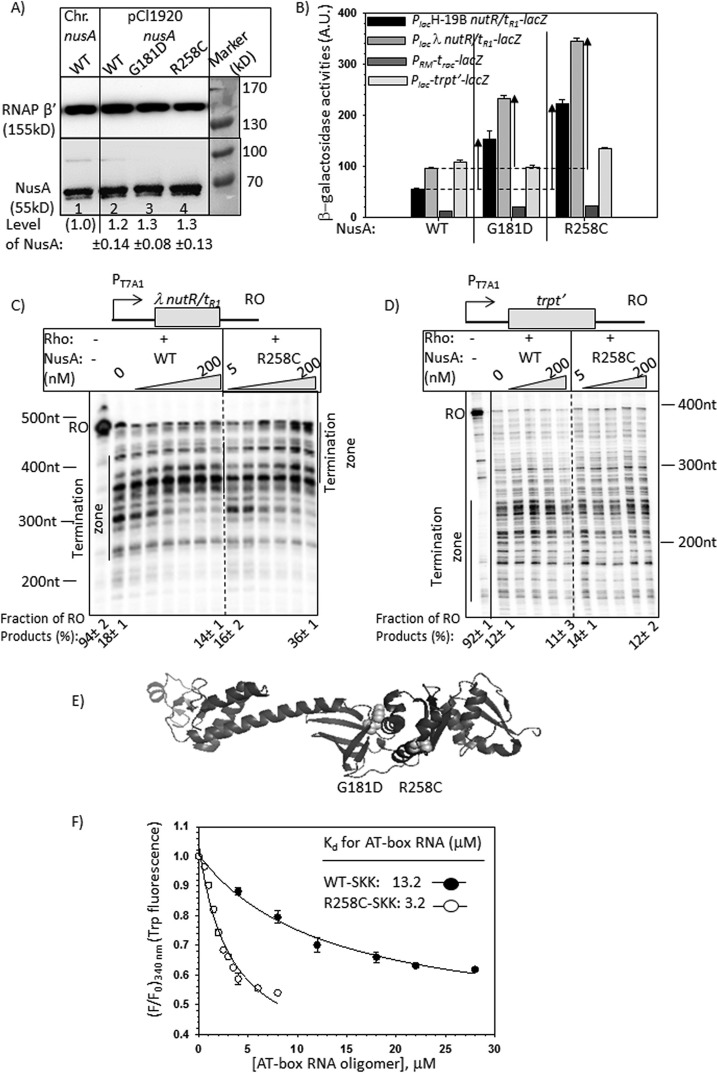
FIGURE 2.
Effects of NusA mutants on the in vivo and in vitro transcriptions. A, Western blots showing the in vivo level of WT and mutant NusA proteins expressed either from chromosome or from pCl1920 plasmids. A monoclonal antibody (Neoclone) of NusA was used. A blot for the β′-subunit of RNAP was used as a loading control. Anti-β′ polyclonal antibody was used for this purpose. Signal intensity of chromosomal NusA (lane 1) was set as 1, and amounts of different NusA proteins in other lanes (lanes 2–4) were expressed with respect to that. In lanes 2–4, MG1655 strain was transformed with the indicated plasmids, following which the chromosomal nusA was deleted by P1 transduction. Equal amounts of cells, as judged by A600, were loaded in each of the lanes. S.D. values (error bars) were obtained from three measurements. Prestained protein molecular weight markers are shown beside the gels to identify the protein size. Note that NusA migrates as a higher molecular weight protein. B, bar diagrams showing the β-galactosidase activities obtained from the lacZ reporter cassettes fused downstream of the different (as indicated) Rho-dependent terminators, trpt′, trac, λtR1, and H-19B tR1. Bars are grouped according to the nusA alleles, as stated. The enhancements in activities in the mutant alleles are indicated by upward arrows. These enhancements indicate termination defects at the Rho-dependent terminators in the presence of mutant nusA alleles. β-Galactosidase activities are expressed in arbitrary units (A.U.). The error bars were obtained from five independent experiments. C and D, autoradiograms showing the in vitro transcription assays performed on indicated linear DNA templates, where transcripts were initiated from the T7A1 promoter. Templates carry the Rho-dependent terminators, nutR/tR1 (C) and trpt′ (D). Triangles, increasing concentrations of NusA ranging from 5 to 200 nm, as indicated. The termination zone and the RO products are marked. The 0 NusA lane represents the Rho alone condition. Amounts of RO in the presence of specific concentrations of NusA are indicated below the gels. RNA length markers are indicated beside the gels. These values were calculated using the equation, [RO] = [RO]/([RO] + intensities of all of the bands in the termination zone). E, schematic showing the locations of the point mutations in the structure of NusA (Protein Data Bank entry 1L2F) as spheres. F, changes in fluorescence intensities of the tryptophan residues of the SKK domain upon the addition of increasing concentrations of 20-mer oligo-RNA having AT-box sequence. F and F0, final and initial intensities at 340 nm, respectively. The average of three independent titration profiles is plotted. The average Kd values indicated in the plots are obtained by fitting the points to a hyperbolic curve.

