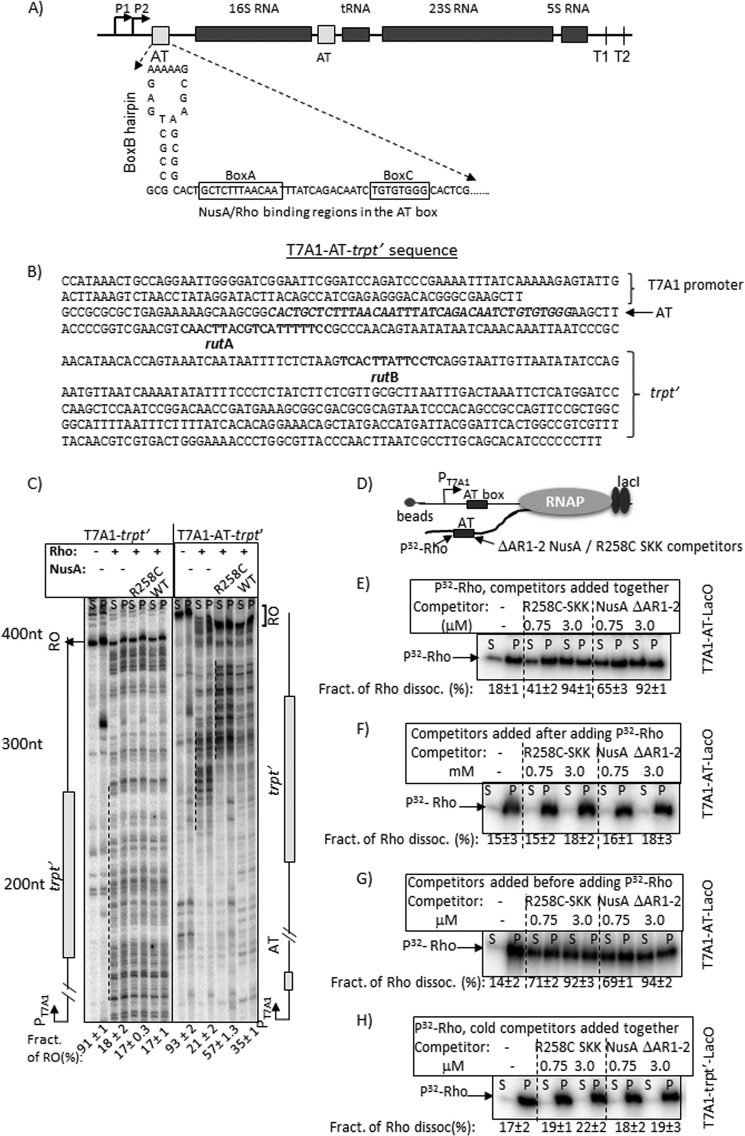
FIGURE 6.
Rho-NusA competition at the AT-box of an rRNA operon. A, schematic showing the AT-box sequence of E. coli rrnG operon together with the flanking regions. B, details of the T7A1-AT-box-trpt′ construct. The T7A1 promoter, AT-box sequence preceding the 16S RNA gene of rrnG operon, and the rut sites of the trpt′ terminator are indicated. C, autoradiograms showing in vitro transcription assays on T7A1-trpt′ and T7A1-AT-trpt′ templates under various indicated conditions. The termination zones (dashed lines) and the RO products are indicated. The amounts of RO product in each transcription reactions are shown below each lane. [RO] was calculated as [RO]/([RO] + total band intensities in the termination zone). RNA length markers are indicated. S.D. values (error bars) were calculated from 2–3 independent experiments. D, schematic showing an EC stalled 44 nt downstream of the AT-box sequence using LacI as a roadblock. The AT-box region is the target of Rho as well as NusA fragments (SKK and ΔAR1–2 NusA) having the RNA-binding domains. E–G, autoradiograms showing the amounts of radiolabeled Rho in supernatant (S; half of the supernatant) and pellet (P; half supernatant + pellet) fractions in the presence of different amounts of the competitors added either with Rho (E) or after adding Rho (F) or before adding Rho (G). Fractions of dissociated Rho in different cases are given below each gel. Fractions of dissociated Rho were calculated as [2S]/([S] + [P]). H, autoradiograms showing a similar competition experiment described in D except that the EC was stalled downstream of the trpt′ terminator, which lacks a bona fide nut site. This template has been described in Fig. 5A. S.D. values (error bars) were obtained from 2–3 independent measurements.

