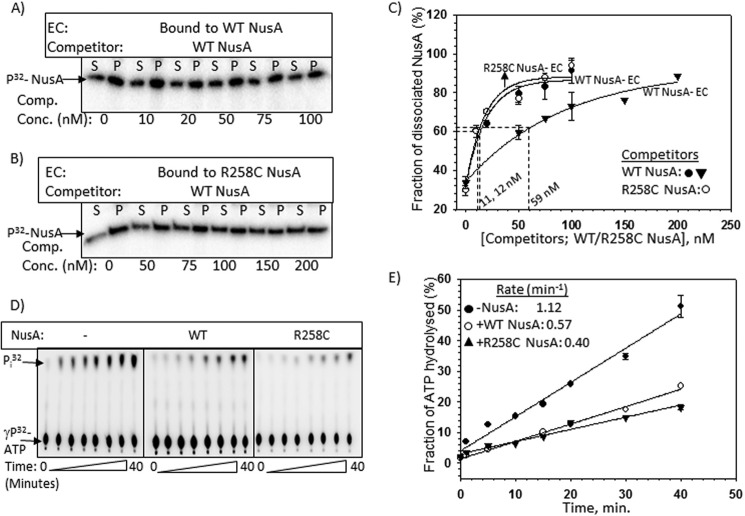
FIGURE 7.
Effects of R258C NusA at the AT-box. A and B, autoradiograms estimating the stability of the complexes formed between radiolabeled WT/R258C NusA and stalled EC. The same template as described in the legend to Fig. 6D was used to form the stalled ECs. The same procedures as described in Fig. 4 were used to perform the competition assays using “cold” WT NusA as competitor. The amounts of dissociated radiolabeled WT or R258C NusA proteins were estimated from the S (half of the supernatant, [S]) and P (pellet plus the rest of the supernatant, [S + P]) fractions. C, curves showing the fractions ([2S]/([S] + [S + P]) of labeled WT/R258C NusA dissociated from the stalled EC upon the addition of increasing concentrations of the cold competitors. Amounts of competitors required to bring about 50% dissociation of the radiolabeled NusA are also indicated. S.D. values (error bars) were obtained from 2–3 experiments. D, representatives thin layer chromatography plates showing the 32Pi release from [γ-32P]ATP due to the RNA-dependent ATPase activities of Rho both in the presence and absence of WT/R258C NusAs. In these experiments, Rho was added to the stalled ECs bound to either WT or R258C NusA, as described in the legend to Fig. 6D. Rho utilizes the nascent RNA of the stalled EC to hydrolyze ATP. E, fractions of ATP hydrolyzed as calculated from the signal intensities of the spots in the thin layer chromatography plates were plotted against time. Symbols are described in the key. Rates of ATP hydrolyzes calculated from the linear fittings of the points are indicated. S.D. values (error bars) were obtained from three sets of measurements.

