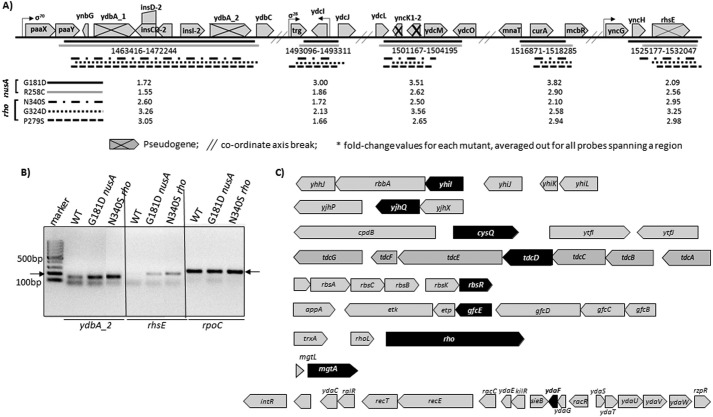
FIGURE 9.
Analyses of the microarray data of the non-coding regions. A, a ∼7.7-kb non-coding region due to the presence of many pseudogenes. This region has been highly up-regulated in both of the NusA mutants (Fig. 8, D and E). Underlined subregions are up-regulated in both the NusA and Rho mutants. Horizontal bars of different styles indicate different Rho and NusA mutants, as indicated. The values of the -fold changes in up-regulation are indicated against each mutant. B, mRNA levels from two of the non-coding regions, ydbA_2 and rhsE, estimated by RT-PCR. Products were made from the total RNA obtained from the strains expressing the indicated NusA and Rho mutants. A significant increase in the amount of RT-PCR signals in the mutant strains was observed. The rpoC product was an internal control. C, examples of highly up-regulated genes (in black) in NusA and Rho mutants that are part of operons with stretches of untranslated regions. Gaps between the genes in each of the operons are likely to be the untranslated regions.

