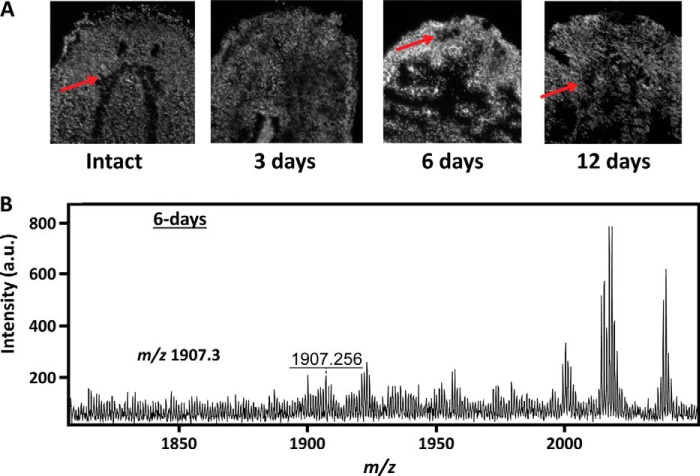
FIGURE 4.
Validation of the MSI results with DAPI fluorescence imaging. A, DAPI fluorescence images of planarian tissue sections at different regeneration time points. The cephalic ganglia are visible in intact planarians and in planarians at 6 and 12 days of regeneration (red arrows). They are not visible in our sample at 3 days of regeneration. B, a weak ion signal for the cephalic ganglia at m/z 1907.3 is observed in 6-day regenerates. Image contrast for the cephalic ganglia is low, likely because of the small ganglia size and low ion intensity.

