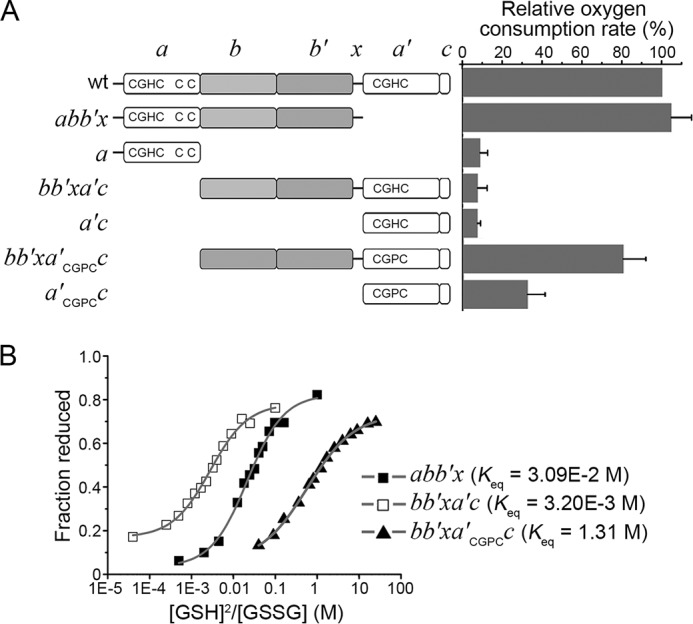
FIGURE 5.

Catalytic oxidation of Pdi1p truncations by hyperactive Ero1p. A, left, schematic representation of Pdi1p mutants. The -CGHC- (-CGPC-) active sites and the non-catalytic cysteine pair were illustrated. Right, the oxygen consumption catalyzed by 2 μm hyperactive Ero1p C150A/C295A during the oxidation of 20 μm Pdi1p proteins in 10 mm GSH was monitored. The oxygen consumption rate was calculated from the slope of the linear phase of oxygen decrease. The relative oxygen consumption rate (%) was calculated as (R − R0)/(R1 − R0) × 100%, where R, rate in the presence of Pdi1p mutants; R1, rate in the presence of Pdi1p wt; R0, rate in the absence of Pdi1p. Data were expressed as mean ± S.D. (n = 3 independent experiments). B, the redox states of Pdi1p proteins at equilibrium with different concentrations of GSH and GSSG monitored by Coomassie staining after mPEG-5k modification. The intensities of the bands were quantified and the fractions of reduced Pdi1p proteins were plotted against to the ratio of [GSH]2/[GSSG]. The resulting Keq were shown and the reduction potentials calculated using Keq were −195 mV for Pdi1p abb′x, −166 mV for Pdi1p bb′xa′c and −244 mV for Pdi1p bb′xa′CGPCc.
