Abstract
Biosensors that report endogenous protein activity in vivo can be based on environment-sensing fluorescent dyes. The dyes can be attached to reagents that bind selectively to a specific conformation of the targeted protein, such that binding leads to a fluorescence change. Dyes that are sufficiently bright for use at low, non-perturbing intracellular concentrations typically undergo changes in intensity rather than the shifts in excitation or emission maxima that would enable precise quantitation through ratiometric imaging. We report here mero199, an environment-sensing dye that undergoes a 33-nm solvent-dependent shift in excitation. The dye was used to generate a ratiometric biosensor of Cdc42 (CRIB199) without the need for additional fluorophores. CRIB199 was used in the same cell with a FRET sensor of Rac1 activation to simultaneously observe Cdc42 and Rac1 activity in cellular protrusions, indicating that Rac1 but not Cdc42 activity was reduced during tail retraction, and specific protrusions had reduced Cdc42 activity. A novel program (EdgeProps) used to correlate localized activation with cell edge dynamics indicated that Rac1 was specifically reduced during retraction.
Graphical abstract
INTRODUCTION
Fluorescent biosensors elucidate the flow of information through signaling networks in living cells and animals.1 To minimize intracellular biosensor concentration, biosensors ideally are bright and fluoresce at wavelengths longer than cellular autofluorescence. Biosensors based on solvent-sensitive fluorescent dyes may be constructed by attaching the dye directly to the protein of interest, where fluorescence changes are associated with changes in conformation.2,3 Alternatively, solvent-sensitive dyes may be attached to ‘affinity reagents’ that bind selectively to a given state of endogenous target proteins, leading to fluorescence change.4–7 Biosensors based on solvent-sensitive dyes offer substantially enhanced sensitivity over the more common biosensors based on fluorescence resonance energy transfer (FRET), in that bright dyes can be directly excited. However, bright dyes are more likely to respond to environment changes with shifts in fluorescence intensity rather than shifts in excitation/emission maxima, as there is an inverse relationship between dye brightness and the extent of solvent-dependent wavelength shifts.8–10 Intensity changes are difficult to measure in cells because intensity is subject to multiple sources of artifacts (e.g. uneven illumination and variations in cell thickness). This has been overcome using ratiometric imaging (Figure 1a), in which a second, minimally-responsive fluorophore is attached to the biosensor. Ratiometric imaging is challenging because it requires site-specific attachment of two fluorophores without perturbing protein activity, and quantitation is complicated when the two fluorophores bleach at different rates. Importantly, two dyes use up more of the wavelength spectrum than would a single fluorophore, making it difficult to use multiple biosensors in the same cell. We describe here mero199, a bright, long wavelength dye that undergoes solvent-dependent changes in its excitation maxima, enabling ratio imaging with a single dye (Figure 1b).
Figure 1.
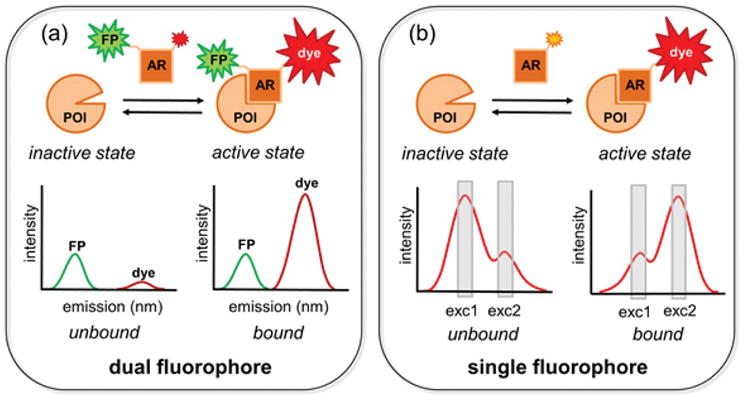
Ratiometric imaging with a dual versus single fluorophore biosensor. (a) The affinity reagent (AR) binds to the protein of interest (POI) only when the POI is in the active state. The changing intensity of the dye (red) relative to the fixed intensity of the fluorescent protein (FP) reflects POI binding. (b) POI activation is reflected simply in the ratio of emission at two different mero199 excitation wavelengths.
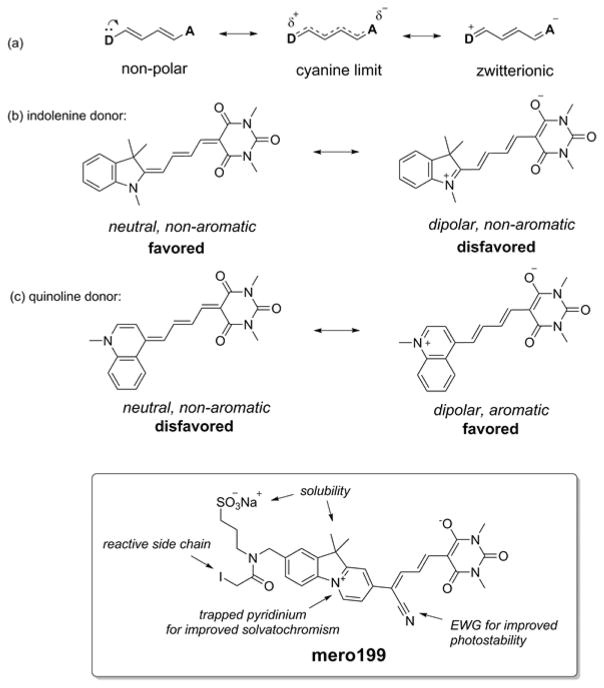
Among environment-sensing small molecule fluorophores, merocyanine dyes are especially well suited for live cell imaging. They can be bright, can emit at wavelengths that minimally overlap with cellular autofluorescence, and can exhibit solvent-dependent changes in extinction coefficient, fluorescence quantum yield (QY) or excitation/emission maxima.11,12 Merocyanine dyes incorporate electron donor and acceptor moieties linked by conjugation.13 The photophysical properties of the dyes depend on the specific donor/acceptor combination and on the nature of the conjugation.8,9,14 Previous studies indicate that brightness is maximized when the ground state is comprised of equal contributions from zwitterionic and non-polar resonance forms (the so-called cyanine limit, Scheme 1a), while solvent sensitivity is maximized when the zwitterionic or non-polar ground states predominate.10,15,16 Consistent with this model, our earlier studies showed that the 3,3-dimethylindolenine donor heterocycle (Scheme 1b) leads to extraordinarily bright dyes when combined with several acceptors, but these dyes all show limited solvent-dependent changes in fluorescence.9 In contrast, we found that pyridine donors and quinoline donors (Scheme 1c) could produce exceptionally large solvent-dependent shifts in fluorescence maxima, but these dyes were too dim for practical live cell imaging.9 Dyes with pyridine and quinoline donors likely favor the ground state zwitterionic resonance form rather than the cyanine limit, because the zwitterionic form increases the aromaticity of the donor heterocycle (unlike the indolenine donor). The quinoline and pyridine-containing dyes showed hypsochromic shifts with increasing solvent polarity,9 indicating that their ground state is more polar than their excited state.17 Dyes with the indolenine donor are brighter not only because they can approach the cyanine limit, but also because the indolenine imparts extended conjugation and its geminal dimethyl substitution reduces aggregation-induced fluorescence quenching. We sought to produce a dye that combined the brightness of the indolenine donor with the solvent response of the quinoline donor, leading to the design of mero199 (Scheme 1), a dye based on a fused pyrido-indolium donor heterocycle.8 Like the quinoline, aromaticity is enhanced when the dye is in the charged form, favoring solvent-sensitivity, but the predominance of the charged resonance form is not as strong as in quinoline itself. This structure proved to be substantially brighter than the quinoline-containing dyes, likely because of the conjugation provided by the indolenine’s 6-membered ring and reduced aggregation.
Scheme 1.
Rational design of ratiometric dye mero199. A fused pyrido-indolium donor heterocycle was included for enhanced solvatochromic properties.
Photobleaching was an important consideration in the development of mero199, as our survey of donor/acceptor combinations had also shown an inverse relationship between solvent sensitivity and photostability.9 Photodegradation of merocyanine dyes proceeds through attack of singlet oxygen at the most nucleophilic α-carbon of the central polymethine chain, and the reactivity of this position is enhanced for dyes further from the cyanine limit.18 A barbituric acid acceptor produced the best compromise between solvent-sensitivity, brightness and photostability (data not shown). Substitution with an electron withdrawing group at the nucleophilic position of the polymethine chain can significantly increase photostability, so we incorporated the cyano group in the mero199 structure.14,18 Finally, a sulfonate group was included for water solubility and a cysteine-reactive iodoacetamide group was included for site-specific labeling of proteins or other affinity reagents.19
RESULTS AND DISCUSSION
Synthesis of mero199 began with condensation of the commercially available 2,3,3-trimethylindolenine (1, Scheme 2) with N-hydroxymethyl-phthalimide, followed by preparation of the product as its perchlorate salt to give compound 2. Conjugate addition of methyl vinyl ketone to compound 2 was followed by heating of the open chain adduct in pyridine to give the fused pyridinium salt (3).20 To ensure protecting group compatibility with subsequent reaction conditions, the phthalimide group was removed and the resulting primary amine was re-protected with Boc, followed by base promoted addition of N,N-dimethylformamide dimethyl acetal to give the enamine 4. Treatment of compound 4 with hydroxylamine-O-sulfonic acid resulted in expulsion of dimethylamine to afford the nitrile-substituted product21 that was subsequently reacted with a barbituric acid bearing a methyl enol ether to give the merocyanine intermediate 5.18 The Boc group was removed under mild neutral conditions using iodotrimethylsilane to give compound 6. The free amine of compound 6 was then reacted with 1,3-propanesultone, followed by treatment with iodoacetic anhydride to provide the desired iodoacetamide-substituted dye, mero199, in a total of 12 linear steps.
Scheme 2.
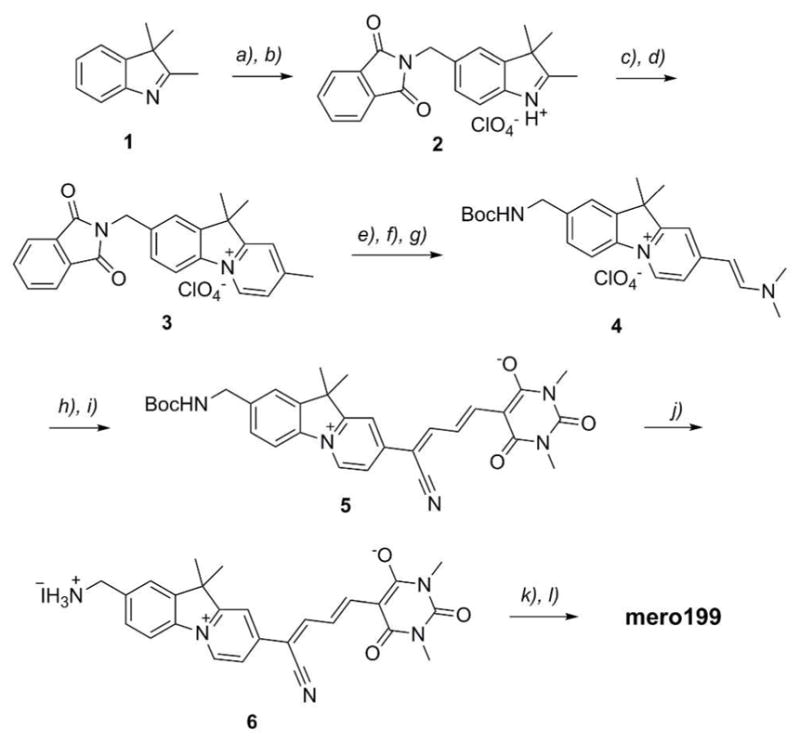
Synthesis of mero199. Reagents and conditions: a) H2SO4, N-hydroxymethyl-phthalimide, 0 °C – RT, 50%; b) HClO4, EtOH, reflux, 90%; c) methyl vinyl ketone, 100 °C, 62%; d) pyridine, reflux, 28%; e) NH2NH2.H2O 3:2 CH2Cl2/MeOH, 98%; f) Boc2O, Et3N, 3:1 CH2Cl2/ACN; g) (CH3O)2CHN(CH3)2, cat. DBU, DMF, 100 °C, 68% from 3; h) NH2SO3H, 1:1 MeOH/H2O; i) 5-(3)-methoxy-allylidene)-1,3-dimethyl-pyrimidine-2,4,6-trione, NaOAc, 1:1 CH2Cl2/MeOH, reflux, 29% from 4; j) (CH3)3SiI, ACN, 87%; k) 1,3-propane sultone, NMP, NaOAc,; l) (ICH2CO)2O, NMP, 30% from 6.
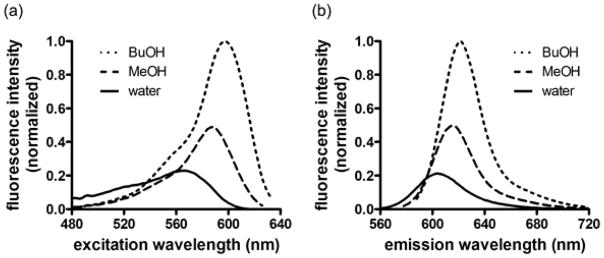
We characterized the effects of solvent polarity on the fluorescence properties of mero199 using previously reported methods (Table 1, Figure 2).9 Increased solvent polarity led to hypsochromic shifts in both excitation and emission maxima, with a difference of 33 nm between the excitation maxima in water and butanol. Extinction coefficients in methanol and butanol were among the highest we have observed (2.1 × 10⁵ M−1cm−1 and 1.9 × 10⁵ M−1cm−1, respectively), and the dye’s relative brightness (ε x QY) compared favorably with other merocyanines that have been used in dye-based biosensors.2,5,9 In water versus butanol, the dye showed a greater than 16-fold change in brightness. The photostability of mero199 was 5.8- fold greater than the reference dye fluorescein (Figure S1). Together, these studies demonstrated that mero199 possessed the desired combination of solvent-sensitive fluorescence, brightness, water solubility, and photostability to be used in ratiometric live cell biosensor applications.
Table 1.
Photophysical characterization of mero199.
| solvent | exc λmax (nm) | em λmax (nm) | ε (M−1cm−1) | QY | ε x QY |
|---|---|---|---|---|---|
| water | 565 | 606 | 48000 | 0.05 | 2400 |
| methanol | 588 | 616 | 211000 | 0.07 | 14700 |
| butanol | 598 | 622 | 185000 | 0.22 | 40500 |
Figure 2.
Excitation (a) and emission (b) fluorescence spectra of mero199 in selected solvents.
We next tested mero199 by using it to make an actual biosensor, based on our previous approach to visualize the nucleotide state of the small GTPase Cdc42 in live cells.4 Cdc42 is a member of the Rho family of GTPases, proteins that regulate diverse aspects of cell behavior including cytoskeletal dynamics and migration.22 The Cdc42/Rac interactive binding (CRIB) domain derived from the Wiskott-Aldrich syndrome protein (WASP) binds only to the “activated,” GTP-bound conformation of Cdc42.23 This domain was mutated to include a single cysteine at position 271, a residue known to be near a hydrophobic pocket generated upon binding of the CRIB domain to activated Cdc42.24 Previous studies showed that environment-sensing fluorophores at this position exhibited significant changes in fluorescence intensity when the labeled CRIB bound to activated Cdc42 in cells.4 Previously-used dyes changed intensity but not excitation/emission maxima, so it had been necessary to attach a second, non-responsive fluorophore to the biosensor for ratio imaging.4,25 Our new biosensor, named CRIB199, was based on attachment of mero199 at the same position. It was assessed in vitro using the methods previously validated for the two fluorophore biosensor.9 CRIB199 showed a 12 nm shift in excitation maximum upon binding Cdc42, while the emission maximum remained at 618 nm (Figure S2). Fluorescence intensity increased nearly 4-fold upon Cdc42 binding. The dissociation constant (Kd) of the Cdc42-biosensor conjugate (219 ± 87 nM) was slightly higher than that of unlabeled CRIB binding to Cdc42 (77 ± 9 nM), as with the previously reported dye-based biosensor (Figure S3).26,4,9 Cdc42 binding induced a maximum decrease in emission at 577 nm, and maximum increase in emission at 605 nm (Figure S4), leading us to use these two wavelengths for ratio imaging.
To test the ability of CRIB199 to report Cdc42 activation in living cells, the biosensor was microinjected into mouse embryonic fibroblasts (MEFs). For ratio imaging, we obtained two images at each time point, one excited with a 577/10 bandpass filter and the other with a 605/15 nm filter, and using a 630/45 nm emission filter for both. Dividing the two images on a pixel by pixel basis as previously described27 yielded a map of ratio values across the cell (Figure 3). As described previously, biosensor concentrations were adjusted to report Cdc42 activity while minimizing perturbation of normal Cdc42 signaling.5,27–29 Consistent with earlier studies, Cdc42 was locally activated in protrusions. A control biosensor with point mutations known to reduce the CRIB domain’s affinity for active Cdc42 (mutantCRIB199, H246D and H249D)4,30 reduced the level of Cdc42 activation seen in the cells (Figures 3 and S5). These studies showed that a biosensor made with mero199 could quantify protein activity in living cells using ratiometric imaging without the need for attachment of a second fluorophore.
Figure 3.
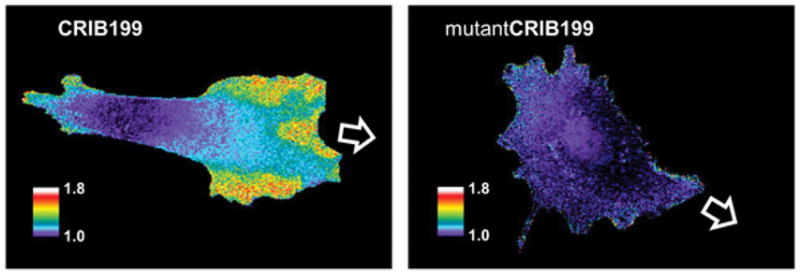
Migrating MEF cells microinjected with CRIB199, the biosensor based on mero199 conjugated to the CRIB domain, show Cdc42 activity in protrusions at the leading edge. Cells containing a mutant biosensor with reduced affinity for Cdc42 (mutantCRIB199) showed substantially less Cdc42 activation (images are scaled identically to show this). The pseudocolor scale shows the increase in ratio relative to the lowest 5% of ratio values in the cell (see Figure S5). These low values were similar for the two biosensors. The white arrow indicates the direction of movement.
One important advantage of CRIB199 is that it uses substantially less of the wavelength spectrum than biosensors based on two fluorophores (e.g. for FRET). To quantify the relative kinetics and subcellular localizations of two complex protein activities, it is valuable to visualize two protein activities in the same cell. Simultaneous imaging can be simplified using biosensors based on mero199. To demonstrate this, we studied activation of Cdc42 and Rac1 by combining CRIB199 with a FRET-based biosensor of Rac129 that uses wavelengths typical of the majority of genetically encoded FRET sensors (Figure 4, Web Enhanced Object 1). Rac1 and Cdc42 both regulate the dynamics of the cell edge during motility and both are active in protrusions.29 It has been shown that there are a variety of protrusions with different functions and differences in signaling,31 but in many cases these cannot be distinguished based simply on inspection of protrusion morphology. We reasoned that Cdc42 and Rac1 would not be activated similarly in all protrusions, enabling us to distinguish live cell protrusions of different function and/or driven by different mechanisms.
Figure 4.
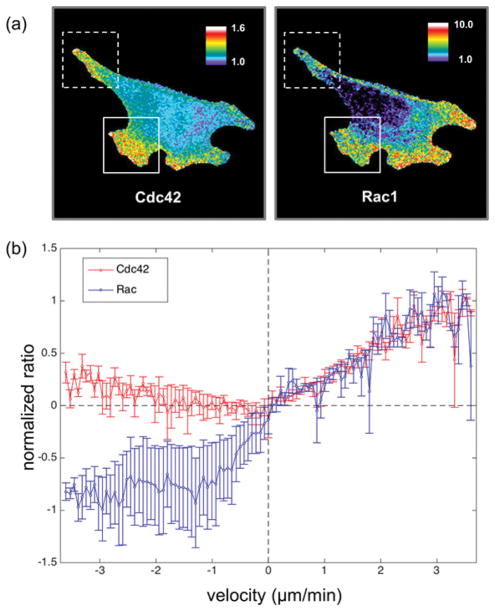
Migrating MEF cells containing both a FRET-based Rac1 biosensor and CRIB199, a Cdc42 biosensor based on mero199 conjugated to the CRIB domain of WASP. (a) Ratiometric images of Cdc42 and Rac1 activity (dotted box = cell tail undergoing retraction, solid box = protrusion along the leading edge). Note that the leading edge protrusion in the box shows high Cdc42 and Rac1 activity, while the protrusion at upper right has similar Rac1 activity but reduced Cdc42 activity. (b) Plot of activation vs. cell edge velocity for Rac1 versus Cdc42 (n = 3 cells). The readouts of the two biosensors were normalized such that when edge velocity was zero, both biosensors were set to zero, and the biosensors’ maximum values (which in both cases occurred for protrusions at maximum velocity) were set equal to 1.
We were concerned that loading two biosensors in the same cell would affect normal morphodynamics. Quantifying protrusion velocity distributions and the extent of protrusion versus retraction indicated that the two biosensors could be used simultaneously with little perturbation of protrusion behavior (Figure S6). Variations in the relative activity of Cdc42 and Rac1 among different protrusions was apparent even from visual inspection of ratio images. The retracting tails of moving cells showed more Cdc42 than Rac1 activity, while protrusions at the leading edge varied -- both Cdc42 and Rac1 were elevated in some protrusions while only Rac1 predominated in others (Figure 4a). This demonstrated the ability of simultaneous imaging to distinguish protrusions on the basis of internal signaling activity. The differences between leading edge protrusions suggested that they had different functions or behaviors despite similar morphology. Activation of Cdc42 in only some protrusions is consistent with its role in controlling the direction of cell movement.22
The absence of Rac1 in retracting cell tails suggested that retraction was associated with reduced Rac1 activity. This is consistent with Rac1’s known role in polymerizing dendritic actin to drive protrusion. To probe this, we developed a software tool (EdgeProps – see Supporting Information) that correlated biosensor activity with the velocity of neighboring regions of the cell edge. For a series of equally spaced points covering the entire edge, the program determined activation level and velocity at each point over time. This analysis revealed that both Cdc42 and Rac1 activity increased with velocity during protrusion, but that Rac1 activity was reduced relative to Cdc42 during retraction (Figure 4b). Cdc42 has been shown to be required for actomyosin contractility at the cell edge, and to be involved in stimulated cell repulsion events, in accordance with these observations.32,33
CONCLUSIONS
In summary, we have developed mero199, a novel dye that enables construction of live cell biosensors using a single dye, yet is capable of ratio imaging. Building a biosensor by using only a single fluorophore facilitates combination with other molecular imaging tools; the excitation and emission wavelengths of mero199 are compatible with pairs of fluorescent proteins used in FRET biosensors, and mero199 excitation does not overlap that of photoresponsive proteins used for optogenetics. GTPases, and many other signaling proteins, show heterogenous and complex responses in living cells. Simultaneous imaging will facilitate the identification of dynamic cellular structures on the basis of multiple signaling activities, and can precisely define the relative localizations and kinetics of activation for two proteins. Dye-based biosensors have seen less use than biosensors based on FRET, likely because they are more cumbersome to introduce into cells. However, they have important advantages in brightness, sensitivity, and their ability to probe different aspects of the intracellular environment. We hope that dye-based biosensors will soon be more accessible given recent efforts to covalently derivatize proteins with great specificity in living cells.34–36
Supplementary Material
Acknowledgments
This work was supported by funding from the American Cancer Society (CJM 119169-PF-10-183-01-TBE) and the National Institutes of Health (P01-GM103723 and P41-EB002025).
Footnotes
A movie of simultaneous Cdc42 and Rac1 activity in AVI format is available in the HTML version of the paper.
Notes
The authors declare no competing financial interest.
Supporting figures, molecular biology, imaging and image analysis methods, experimental procedures and spectroscopic data for new compounds. This material is available free of charge via the Internet at http://pubs.acs.org.
References
- 1.Sample V, Mehta S, Zhang J. J Cell Sci. 2014;127:1151. doi: 10.1242/jcs.099994. [DOI] [PMC free article] [PubMed] [Google Scholar]
- 2.Hahn K, Debiasio R, Taylor DL. Nature. 1992;359:736. doi: 10.1038/359736a0. [DOI] [PubMed] [Google Scholar]
- 3.Garrett SC, Hodgson L, Rybin A, Toutchkine A, Hahn KM, Lawrence DS, Bresnick AR. Biochemistry. 2008;47:986. doi: 10.1021/bi7021624. [DOI] [PMC free article] [PubMed] [Google Scholar]
- 4.Nalbant P, Hodgson L, Kraynov V, Toutchkine A, Hahn KM. Science. 2004;305:1615. doi: 10.1126/science.1100367. [DOI] [PubMed] [Google Scholar]
- 5.Gulyani A, Vitriol E, Allen R, Wu J, Gremyachinskiy D, Lewis S, Dewar B, Graves LM, Kay BK, Kuhlman B, Elston T, Hahn KM. Nat Chem Biol. 2011;7:437. doi: 10.1038/nchembio.585. [DOI] [PMC free article] [PubMed] [Google Scholar]
- 6.Szent-Gyorgyi C, Schmidt BA, Creeger Y, Fisher GW, Zakel KL, Adler S, Fitzpatrick JAJ, Woolford CA, Yan Q, Vasilev KV, Berget PB, Bruchez MP, Jarvik JW, Waggoner A. Nat Biotechnol. 2008;26:235. doi: 10.1038/nbt1368. [DOI] [PubMed] [Google Scholar]
- 7.Chen CA, Yeh RH, Yan X, Lawrence DS. Biochim Biophys Acta. 2004;1697:39. doi: 10.1016/j.bbapap.2003.11.012. [DOI] [PubMed] [Google Scholar]
- 8.Toutchkine A, Han WG, Ullmann M, Liu TQ, Bashford D, Noodleman L, Hahn KM. J Phys Chem A. 2007;111:10849. doi: 10.1021/jp073197r. [DOI] [PMC free article] [PubMed] [Google Scholar]
- 9.MacNevin CJ, Gremyachinskiy D, Hsu CW, Li L, Rougie M, Davis TT, Hahn KM. Bioconjugate Chem. 2013;24:215. doi: 10.1021/bc3005073. [DOI] [PMC free article] [PubMed] [Google Scholar]
- 10.Bublitz GU, Ortiz R, Marder SR, Boxer SG. J Am Chem Soc. 1997;119:3365. [Google Scholar]
- 11.Kulinich AV, Derevyanko NA, Ishchenko AA. Russ J Gen Chem. 2006;76:1441. [Google Scholar]
- 12.Kulinich AV, Ishchenko AA. Russ Chem Rev. 2009;78:141. [Google Scholar]
- 13.Shirinian VZ, Shimkin AA. Top Het Chem. 2008;14:75. [Google Scholar]
- 14.Toutchkine A, Kraynov V, Hahn K. J Am Chem Soc. 2003;125:4132. doi: 10.1021/ja0290882. [DOI] [PubMed] [Google Scholar]
- 15.Ortiz R, Marder SR, Cheng LT, Tiemann BG, Cavagnero S, Ziller JW. J Chem Soc Chem Comm. 1994;2263 [Google Scholar]
- 16.Wurthner F, Archetti G, Schmidt R, Kuball HG. Angew Chem Int Edit. 2008;47:4529. doi: 10.1002/anie.200800279. [DOI] [PubMed] [Google Scholar]
- 17.Buncel E, Rajagopal S. Accounts Chem Res. 1990;23:226. [Google Scholar]
- 18.Toutchkine A, Nguyen DV, Hahn KM. Org Lett. 2007;9:2775. doi: 10.1021/ol070780h. [DOI] [PubMed] [Google Scholar]
- 19.Toutchkine A, Nguyen DV, Hahn KM. Bioconjugate Chem. 2007;18:1344. doi: 10.1021/bc060376n. [DOI] [PMC free article] [PubMed] [Google Scholar]
- 20.Chapman DD, Elwood JK, Heseltine DW, Hess HM, Kurtz DW. J Org Chem. 1977;42:2474. [Google Scholar]
- 21.Biere H, Russe R. Tetrahedron Lett. 1979;1361 [Google Scholar]
- 22.Jaffe AB, Hall A. Ann Rev Cell Dev Bio. 2005;21:247. doi: 10.1146/annurev.cellbio.21.020604.150721. [DOI] [PubMed] [Google Scholar]
- 23.Symons M, Derry JMJ, Karlak B, Jiang S, Lemahieu V, McCormick F, Francke U, Abo A. Cell. 1996;84:723. doi: 10.1016/s0092-8674(00)81050-8. [DOI] [PubMed] [Google Scholar]
- 24.Abdul-Manan N, Aghazadeh B, Liu GA, Majumdar A, Ouerfelli O, Siminovitch KA, Rosen MK. Nature. 1999;399:379. doi: 10.1038/20726. [DOI] [PubMed] [Google Scholar]
- 25.Goguen BN, Loving GS, Imperiali B. Bioorg Med Chem Lett. 2011;21:5058. doi: 10.1016/j.bmcl.2011.04.051. [DOI] [PMC free article] [PubMed] [Google Scholar]
- 26.Rudolph MG, Bayer P, Abo A, Kuhlmann J, Vetter IR, Wittinghofer A. J Biol Chem. 1998;273:18067. doi: 10.1074/jbc.273.29.18067. [DOI] [PubMed] [Google Scholar]
- 27.Hodgson L, Nalbant P, Shen F, Hahn K. Method Enzymol. 2006;406:140. doi: 10.1016/S0076-6879(06)06012-5. [DOI] [PubMed] [Google Scholar]
- 28.El-Sibai M, Nalbant P, Pang H, Flinn RJ, Sarmiento C, Macaluso F, Cammer M, Condeelis JS, Hahn KM, Backer JM. J Cell Sci. 2007;120:3465. doi: 10.1242/jcs.005942. [DOI] [PMC free article] [PubMed] [Google Scholar]
- 29.Machacek M, Hodgson L, Welch C, Elliott H, Pertz O, Nalbant P, Abell A, Johnson GL, Hahn KM, Danuser G. Nature. 2009;461:99. doi: 10.1038/nature08242. [DOI] [PMC free article] [PubMed] [Google Scholar]
- 30.Miki H, Sasaki T, Takai Y, Takenawa T. Nature. 1998;391:93. doi: 10.1038/34208. [DOI] [PubMed] [Google Scholar]
- 31.Condeelis J. Annu Rev Cell Biol. 1993;9:411. doi: 10.1146/annurev.cb.09.110193.002211. [DOI] [PubMed] [Google Scholar]
- 32.Wilkinson S, Paterson HF, Marshall CJ. Nat Cell Biol. 2005;7:255. doi: 10.1038/ncb1230. [DOI] [PubMed] [Google Scholar]
- 33.Groeger G, Nobes CD. Biochem J. 2007;404:23. doi: 10.1042/BJ20070146. [DOI] [PMC free article] [PubMed] [Google Scholar]
- 34.Plass T, Schultz C. Springer Ser Fluores. 2011;10:225. [Google Scholar]
- 35.Uttamapinant C, Howe JD, Lang K, Beranek V, Davis L, Mahesh M, Barry NP, Chin JW. J Am Chem Soc. 2015;137:4602. doi: 10.1021/ja512838z. [DOI] [PMC free article] [PubMed] [Google Scholar]
- 36.Schmied WH, Elsasser SJ, Uttamapinant C, Chin JW. J Am Chem Soc. 2014;136:15577. doi: 10.1021/ja5069728. [DOI] [PMC free article] [PubMed] [Google Scholar]
Associated Data
This section collects any data citations, data availability statements, or supplementary materials included in this article.


