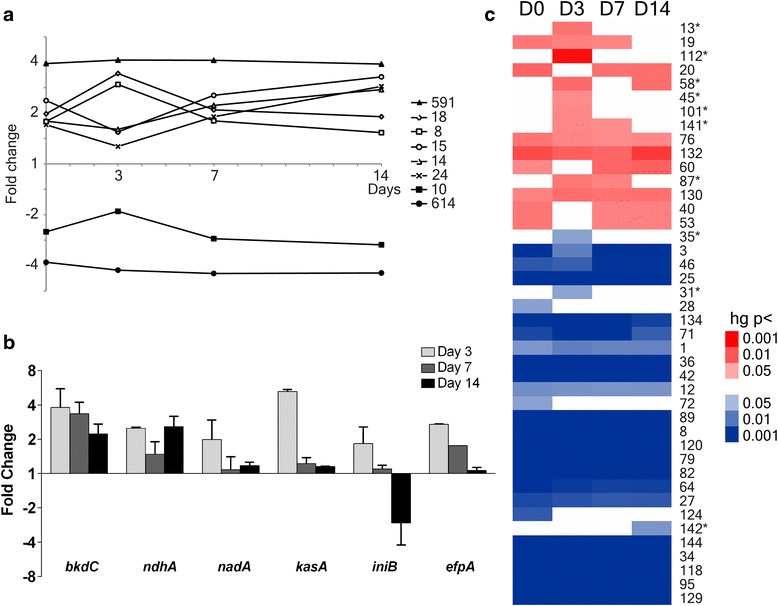
Fig. 3.

The changing M.tb transcriptional pattern in sputum over time, highlighting day 3 as an inflection point. a Significantly represented temporal gene expression profiles in M.tb bacilli extracted from sputa relative to log phase bacilli using short time-series expression miner (STEM). The numbers of genes assigned to each gene expression curve are marked. b Quantitative RT-PCR defining day 3-specific induction of bkdC, ndhA, nadA, kasB, iniB and efpA plotted at 3, 7 and 14 days after the start of drug therapy. Log2 expression ratios are plotted; the y-axis detailing fold change relative to day 0 sputum bacilli. Error bars mark the standard error of the mean. c Significantly enriched gene clusters, previously defined in response to antimicrobial drugs [23], in M.tb derived from sputum at 0, 3, 7 and 14 days after the start of chemotherapy. Greater statistical significance is indicated by increasing depth of colour (minimum hypergeometric p-value <0.05). Gene clusters in red overlap with genes up-regulated (blue, down-regulated) in sputum compared to aerobic log phase bacilli. Gene clusters are labelled numerically as in [23]. Ten gene clusters were identified as significantly enriched only after drug treatment had started (marked with asterisks). Gene clusters 101, 31, 35 and 142 reflect exposure to pyrazinamide and rifampicin; cluster 45 to rifampicin alone; and cluster 87 to pyrazinamide alone. Of the ten enriched drug responsive gene clusters, six were only significant at day 3
