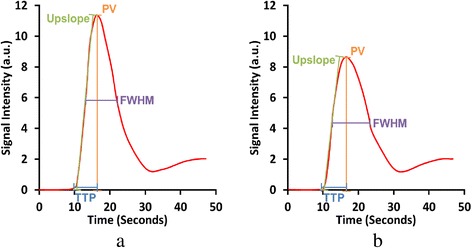
Fig. 6.

Quality metrics for evaluating different AIF curves measured from the same study. Curve a is more characteristic of a good AIF than curve b due to a higher peak value (PV), larger upslope, shorter time to peak (TTP), and thinner full-width at half-maximum (FWHM). The m-value (Eq. 1) is also higher for curve a
