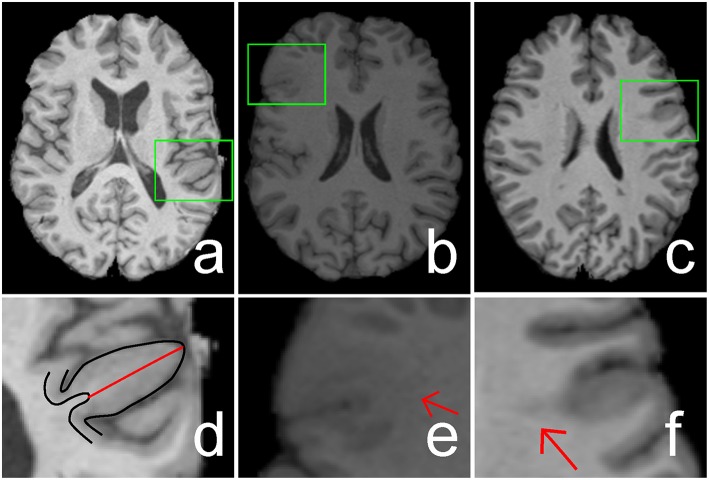
Figure 1.
Illustrations of cortical thickening (A), blurring of gray matter (GM)/white matter (WM) junction (B), and hyper-intensity signal (C) within focal cortical dysplasia (FCD) regions (indicated by green rectangles). The FCD regions in (A–C) are enlarged and shown in (D–F), respectively. The black lines in image (D) are the boundaries of GM or cortex, whereas the length of the red line shows the increased cortical thickness. Image (E) shows that the GM and WM have a blurry boundary (indicated by a red arrow). Hyper-intensity signal within the WM region is indicated by a red arrow in image (F).

