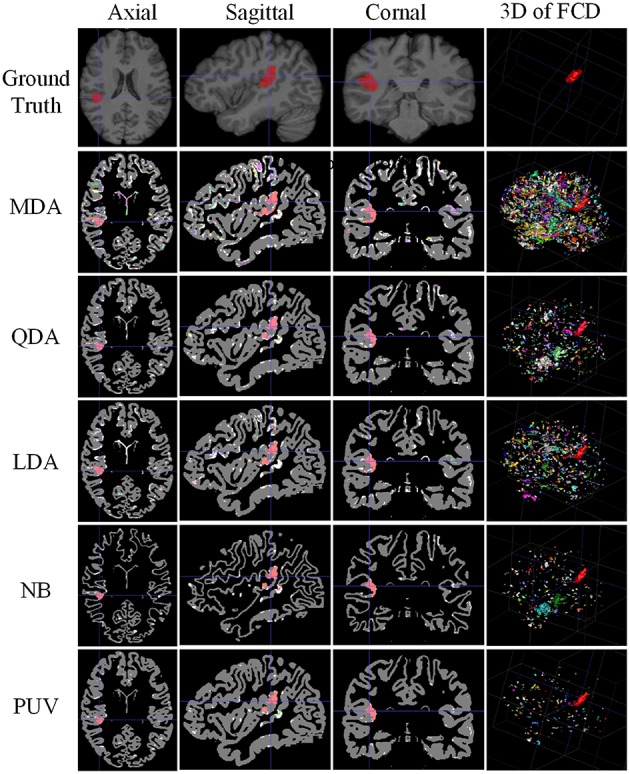
Figure 10.

Comparison of examples of classified images from positive unanimous voting (PUV) and single classifiers used in this study. From top to bottom, images of each row are ground truth and classified images from Mahalanobis discriminant analysis, quadratic discriminant analysis, linear discriminant analysis, naïve Bayesian, and PUV. From left to right, columns show axial, sagittal, coronal, and 3D views. For illustration purposes, the different connected regions of positive results are described by different colors on the 3D views. FCD regions are colored red.
