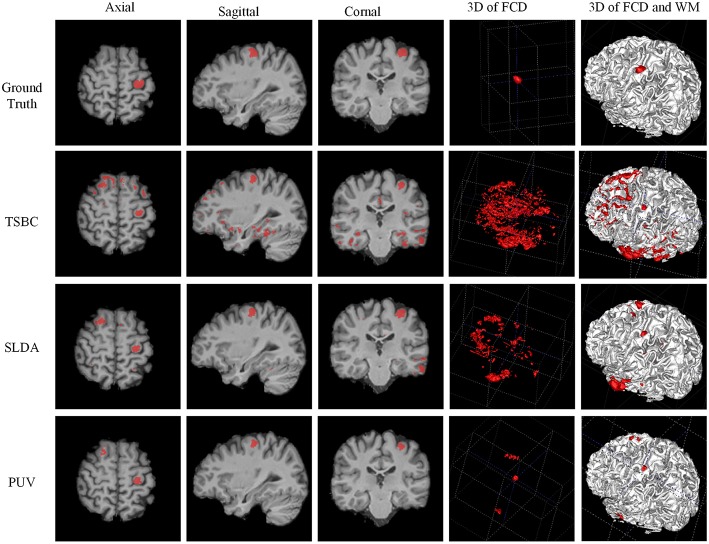
Figure 11.
Examples of classification results of the 3D image from patient 8 with FCD lesions. From left to right rows: axial, sagittal, coronal, and two 3D views. In the ground truth image (the first row), the FCD regions are in red. From the results of two-stage Bayesian classifiers, surface-based LDA, and PUV methods (from second row to the bottom row), the voxels and vertex identified as positive (FCD) are also in red.

