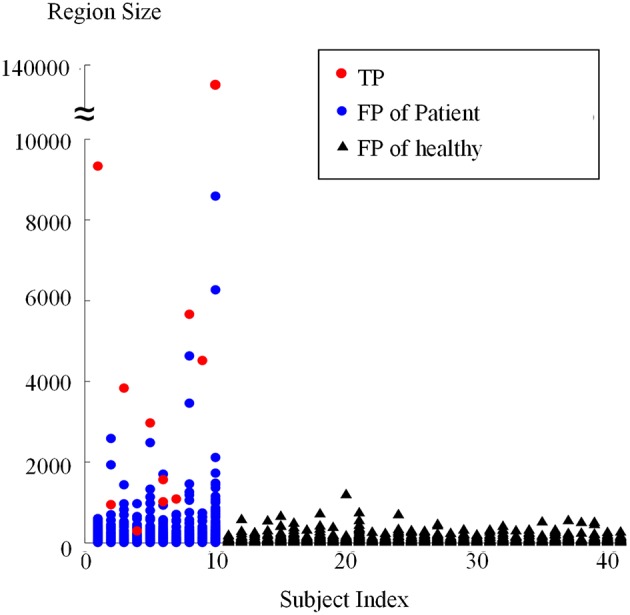
Figure 12.

Sizes of regions classified as positive from patients and healthy controls using connected region analysis. The red dots are the region size values of the true FCD lesions, blue dots are the region sizes of FP regions in patients, and black triangles are the region sizes of FP regions of healthy controls.
