Figure 6.

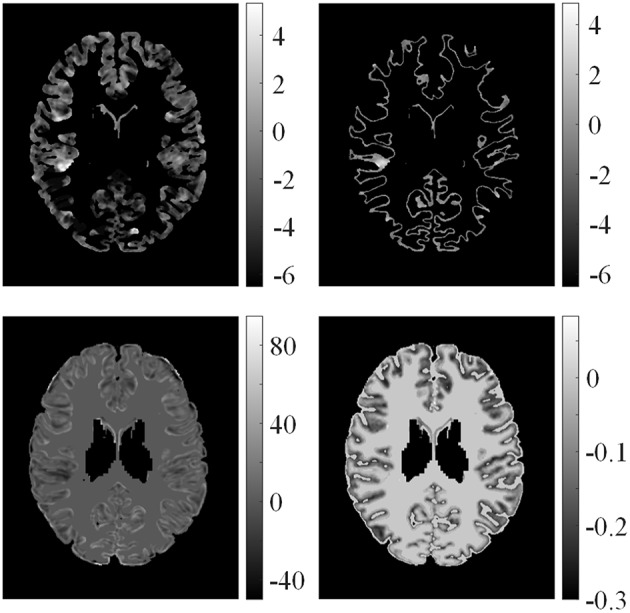
Examples of feature differences between test images and healthy controls. From left top row, clockwise: feature differences of GM thickness map, GWB width map, gradient map, and relative intensity map from one patient.

Examples of feature differences between test images and healthy controls. From left top row, clockwise: feature differences of GM thickness map, GWB width map, gradient map, and relative intensity map from one patient.