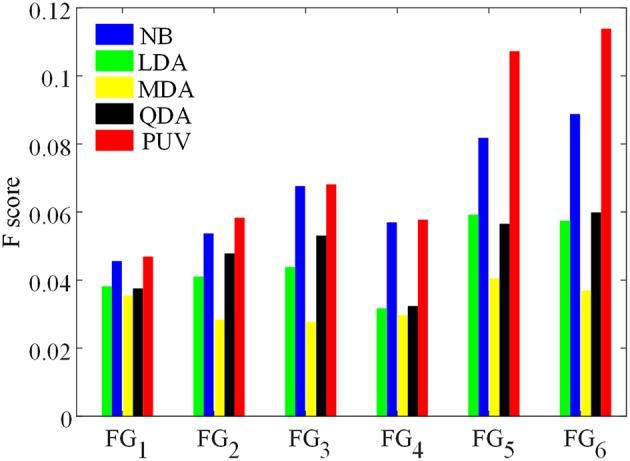
Figure 9.

Comparison of F-scores of the classification results from different feature groups and classification methods. The feature groups FG1−6 are defined in Table 1. FG1 includes maps of GM thickness, gradient, and relative intensity. FG2 includes maps in FG1 and the GM/WM width map. FG3 includes maps of GM thickness, relative intensity and GM/WM width. The values of FG4−6 are feature differences that included the influence of healthy controls, and corresponded to the FG1−3, respectively.
