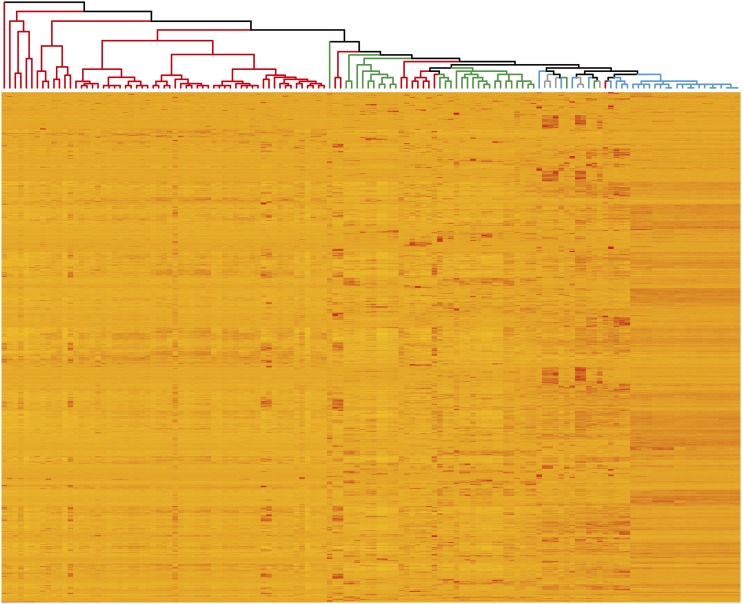
Figure 2.
Similarity of expression profiles between samples (columns), with replicate samples averaged and excluding samples from nullitetrasomic lines. One thousand randomly selected genes are represented, one gene per row. Only genes expressed in at least one sample over 2 tpm were used. Colors on the dendrogram indicate the tissues from which samples originate: grain (red), spike excluding grain (blue), leaves/stem (green), and roots (gray).

