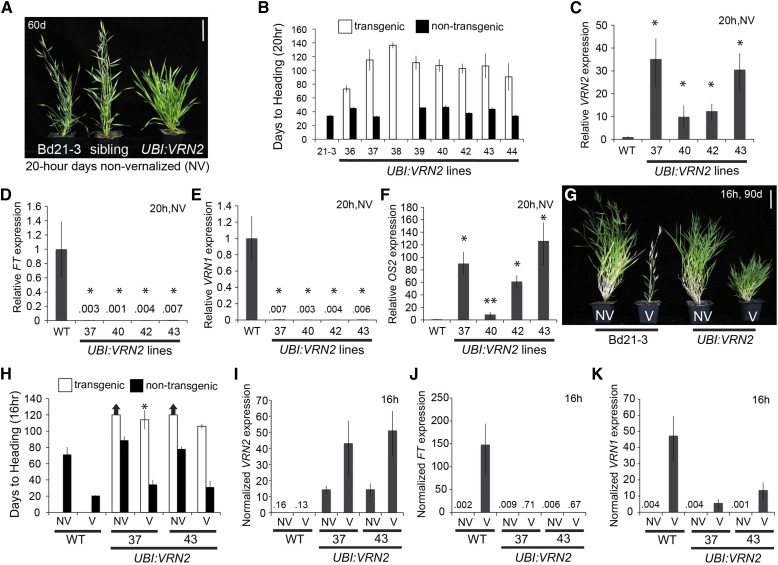
Figure 5.
VRN2 overexpression delays flowering. A, Representative photo of Bd21-3 wild-type, nontransgenic sibling, and delayed flowering UBI:VRN2 plants grown in a 20-h photoperiod without vernalization (NV) 60 d postgermination. Bar = 5 cm. B, Days to heading for Bd21-3 wild type (WT) and segregating nontransgenic (black bars) compared with independent UBI:VRN2 transgenic (white bars) plants. Lines with no nontransgenic plants are fixed for the transgene. Bars represent the average of six plants ± sd. The experiment was repeated with similar results (data not shown). C to F, Quantitative RT-PCR expression data from the third leaf of Bd21-3 wild type and UBI:VRN2 plants at the three-leaf stage grown in 20-h photoperiods without vernalization. Average relative BdVRN2 (C), BdFT (D), BdVRN1 (E), and BdOS2 expression (F) is shown for three biological replicates ± sd. Expression analyses were repeated with similar results. G, Representative photo of nonvernalized and 4-week 5°C vernalized (V) Bd21-3, and UBI:VRN2 plants grown for 90 d under a 16-h photoperiod. Bar = 5 cm. H, Days to heading for Bd21-3 wild type and segregating nontransgenic (black bars) compared with independent UBI:VRN2 transgenic (white bars) plants. Bars represent the average of six plants ± sd. Arrows above bars indicate that none of the plants flowered at the end of the experiment (120 d), and asterisks indicate that only some plants in the treatment did not flower after 120 d. I to K, Average relative qRT-PCR data from the upper leaf of Bd21-3 wild type and UBI:VRN2 plants at the three-leaf stage grown in a 16-h photoperiod with and without vernalization. BdVRN2 (I), BdFT (J), and BdVRN1 expression (K) is shown for three biological replicates ± sd.

