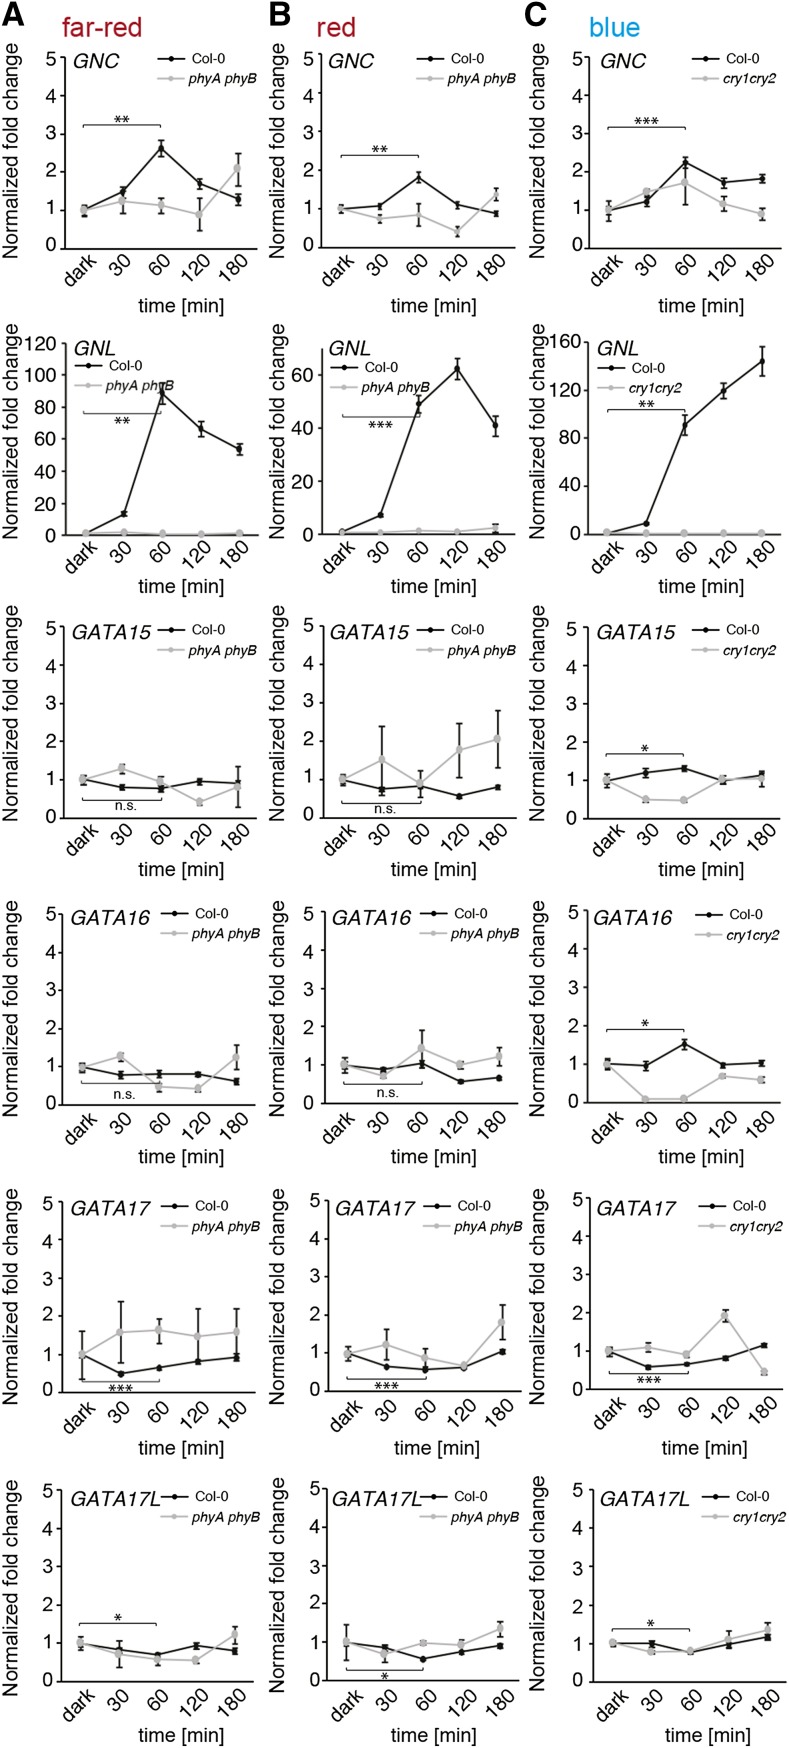
Figure 2.
GATA gene expression in far-red, red, and blue light conditions. A, B, C, Averages and ses of three replicate qRT-PCR analyses of 4-d-old dark-grown seedlings after transfer to (A) far-red (0.35 μmol s−1 m−2), (B) red (7.2 μmol s−1 m−2), and (C) blue light (4.25 μmol s−1 m−2). The phyA phyB and cry1 cry2 light receptor mutants were used to control the specificity of the respective treatment, and to control for background gene expression. Gene expression data were normalized to the transcript abundance detected in the dark sample of the respective genotype. Student’s t test for selected time points: * P ≤ 0.05; ** P ≤ 0.01; *** P ≤ 0.001; n.s. = not significant.

