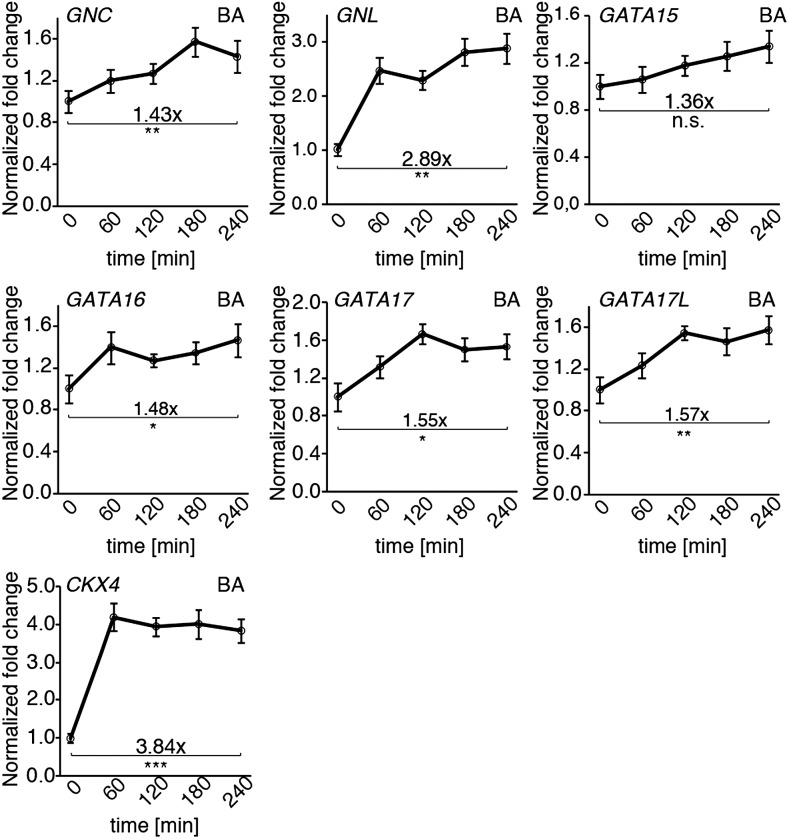
Figure 3.
GATA gene expression is induced by cytokinin. Averages and ses of three replicate qRT-PCR analyses of 10-d-old seedlings that had been treated for the times indicated with 10 μM 6-BA. Expression changes for CKX4 are shown to verify the effectiveness of the hormone treatment. The expression values for each time point were normalized to those of an untreated mock sample. The fold change is shown relative to time point 0, which was set to 1. Student’s t test for selected time points: * P ≤ 0.05; ** P ≤ 0.01; *** P ≤ 0.001; n.s. = not significant.

