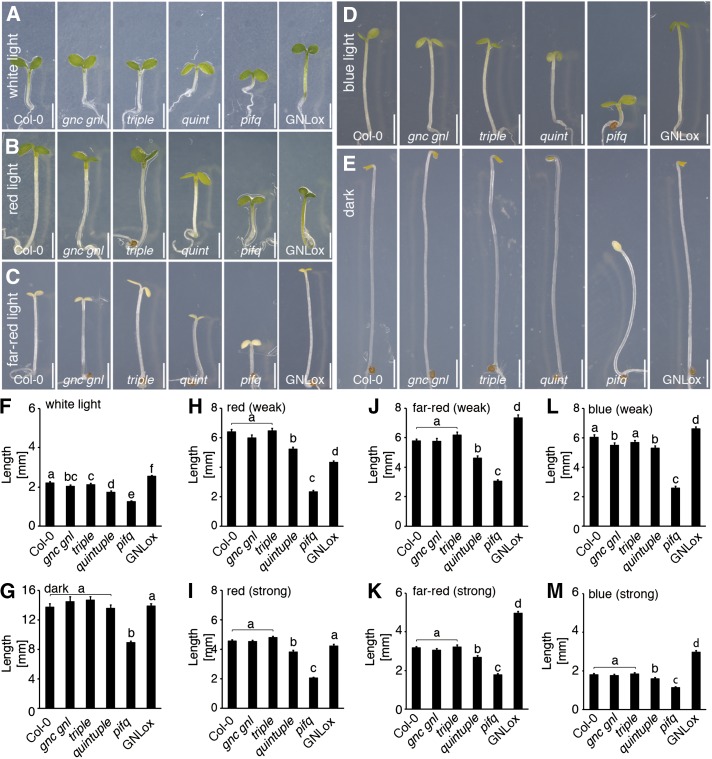
Figure 4.
GATA factors contribute to hypocotyl elongation. A, B, C, D, E, Representative photographs; and F, G, H, I, J, K, L, M, averages and ses from hypocotyl measurements of 5-d-old seedlings (n ≥ 50) grown in white light (A and F), weak and strong red light (B, H, I), weak and strong far-red light (C, J, K), weak and strong blue light (D, L, and M), and in the dark (E and G). Scale bar = 2 mm. Student’s t test: datasets with no statistical difference fall in one group and were labeled accordingly.

