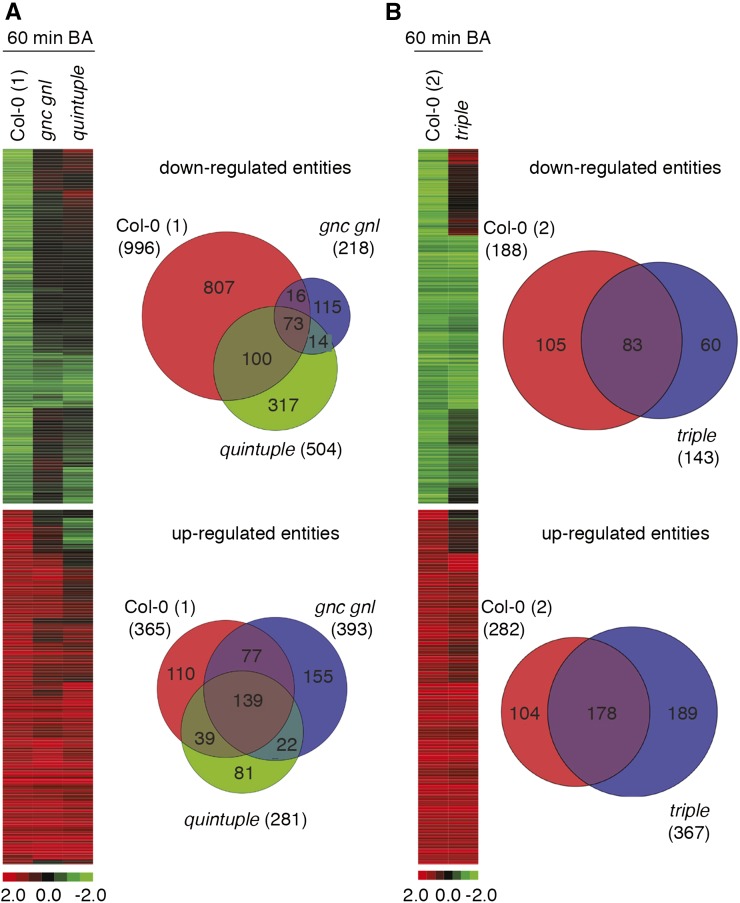
Figure 6.
Cytokinin-responsive gene expression is impaired in gata mutants. A, B, Heat maps and Venn diagrams of differentially expressed genes from Col-0 and the gata mutants after 60-min CK treatment. The experiment was performed in two rounds with two independent wild-type controls referred to as Col-0 (1) and Col-0 (2). Down- and up-regulated genes are shown in the top and bottom panels, respectively. Venn diagrams showing the overlap in differential gene expression for genes that were down- and up-regulated following CK treatment in the respective Col-0 wild type and their expression in the respective gata mutants. Gene expression identities and data are shown in Supplemental Table S2.

