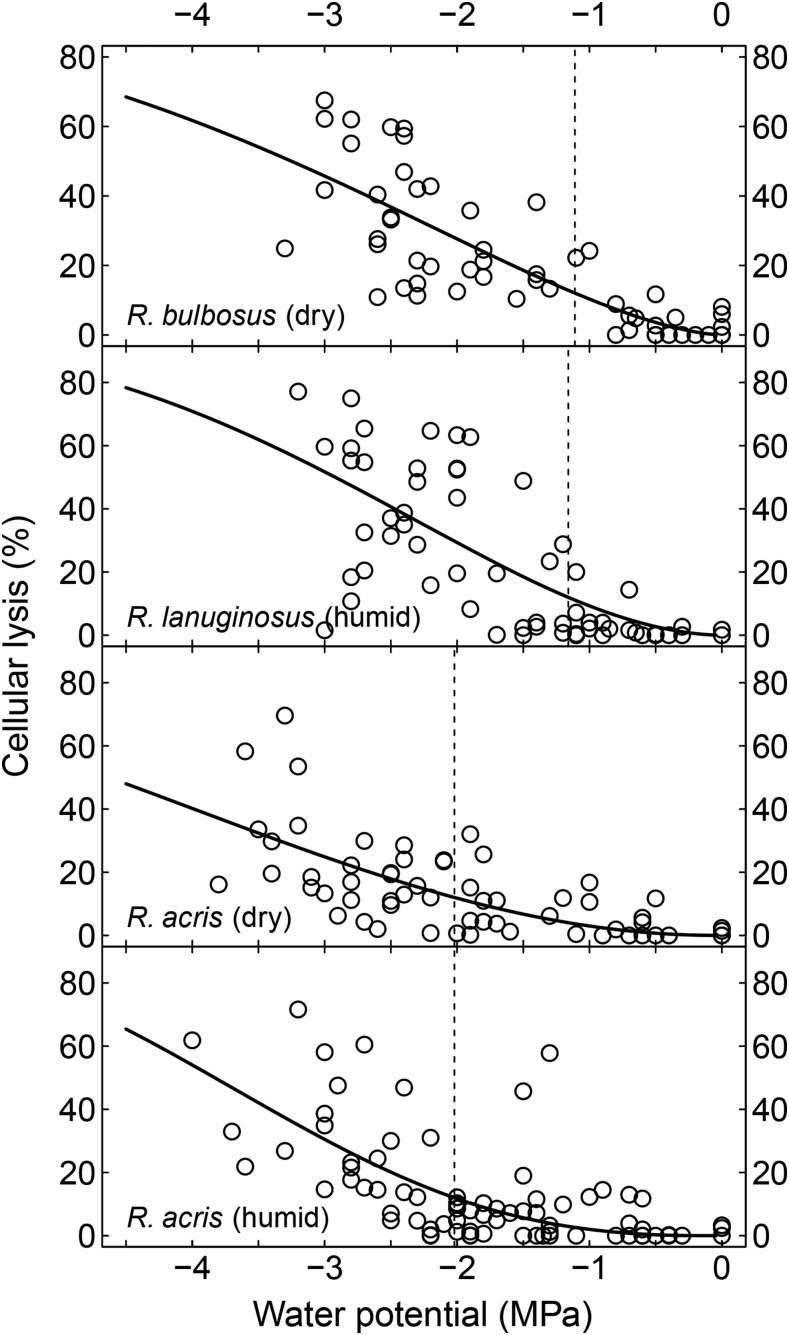
Figure 3.
Cellular lysis (percentage of maximum after autoclaving) versus Ψ in R. bulbosus, R. lanuginosus, and dry and humid R. acris populations. Vertical lines (dashed) indicate the onset of damage to living cells (P12CL). Curves were extrapolated using the same equation and parameters used for vulnerability curves (Eq. 2).

