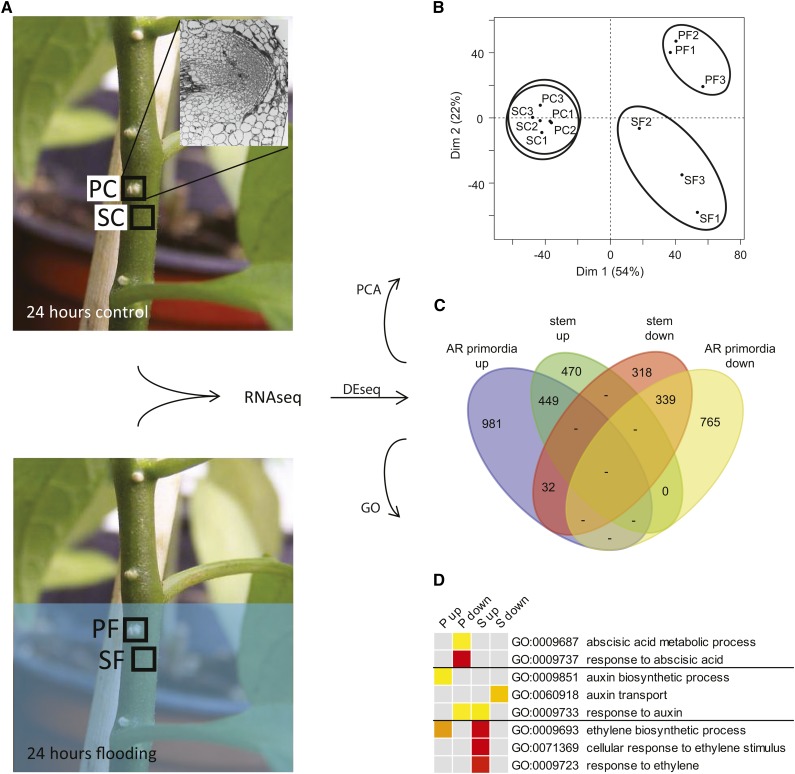
Figure 1.
Flooding leads to extensive transcriptomic reprogramming in stem and AR primordia of S. dulcamara. A, Analysis pipeline showing the origin and processing of the four sample types (n = 3). Inset in the top left photo represents the composition of a primordium sample. B, PC analysis score plot showing the differentiation between the four sample types. C, Venn diagram of all genes differentially expressed in AR primordia and/or stem tissue upon flooding (fold change ≥ 2, false discovery rate ≤ 0.05). D, GO analysis of hormone-related categories. Color scale indicates significance of enrichment, from false discovery rate = 1 × 10⁻² (yellow) to false discovery rate = 1 × 10⁻⁶ (red). PC, Primordia control; PF, primordia flooded; SC, stem control; SF, stem flooded; P, primordia; S, stem; up, up-regulated genes; down, down-regulated genes.

