Figure 3.
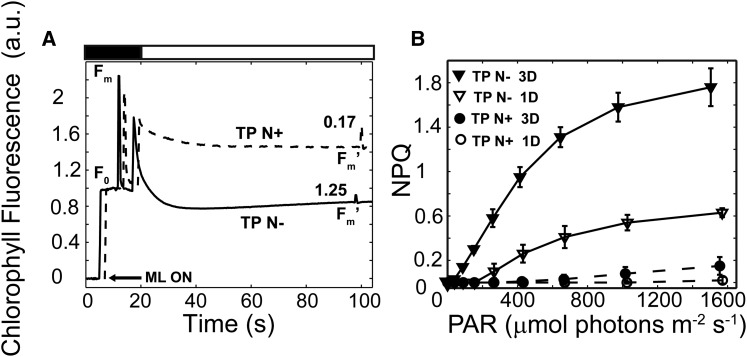
C. reinhardtii cells generate high levels of NPQ during photoautotrophic N deprivation. A, Representative Chl fluorescence traces of photoautotrophically grown, nutrient-replete (TP N+; dashed line) and N-deprived (TP N−; solid line) cells after growth in LL for 3 d. Prior to the analyses, the cells were dark adapted for 30 min followed by a brief exposure (20 s) to dark in which a saturating flash was applied (Fm) and then to HL (750 µmol photons m−2 s−1; white bar) for 80 s. The average (n = 3) NPQ values are presented above the Fm′ fluorescence peaks. Chl fluorescence traces were normalized to minimum fluorescence (F0). For convenient visualization, the kinetic traces for the nutrient-replete and N-deprived cells are shifted by 2 s. The arrow indicates activation of the measuring light (ML ON). a.u., Arbitrary units. B, NPQ at different light intensities was calculated from Chl fluorescence measurements of TP N+ (circles) and TP N− (triangles) cells grown in LL for 1 d (white symbols) and 3 d (black symbols). n = 3 ± sd. PAR, Photosynthetically active radiation.

