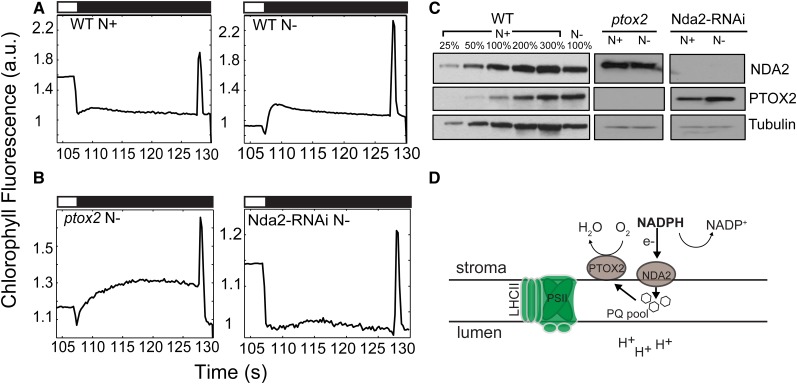
Figure 6.
Chlororespiration is induced during N deprivation under photoautotrophic conditions. Representative Chl fluorescence traces are shown following light extinction (black bars) after 3 d of photoautotrophic growth. A, Wild-type (WT) cells under nutrient-replete (top left) and N-deplete (top right) conditions. B, ptox2 (bottom left) and Nda2-RNAi (bottom right) mutant strains under N-deplete conditions. All cells were exposed to HL (750 µmol photons m−2 s−1; white bars) prior to a dark period, as indicated in “Materials and Methods.” All Chl fluorescence traces were normalized to F0. a.u., arbitrary units. C, Immunoblot analysis for PTOX2 and NDA2 in wild-type, ptox2, and Nda2-RNAi strains under nutrient-replete (N+) and N-deplete (N−) growth conditions. Each lane contains protein from solubilized cells containing 2 μg of Chl. Different amounts of wild-type membranes were analyzed, as indicated. D, Schematic representation of the chlororespiratory pathway in darkness (or after the transition from light to darkness) as described in the text.

