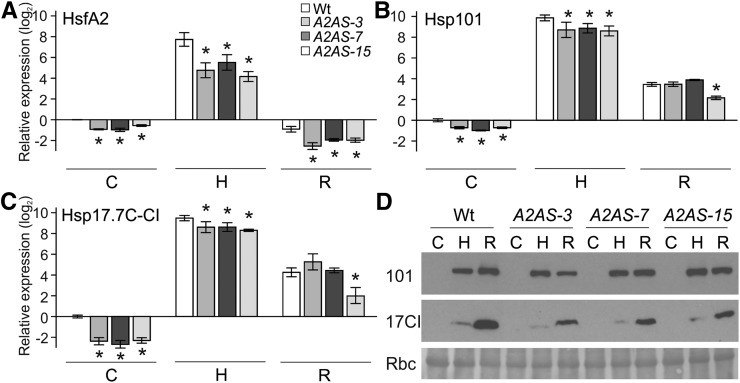
Figure 2.
HSR of young leaves of wild-type and A2AS transgenic plants. A to C, Relative gene expression (2–ΔΔCt) of HsfA2 (A), Hsp17.7C-CI (B), and Hsp101 (C) in leaves from wild-type and A2AS transgenic plants exposed to HS at 39°C for 1 h (sample H) and then allowed to recover for 1.5 h (sample R) or kept under control conditions for the same period (sample C). The expression was determined and represented as in Fig. 1A. Vertical bars are the average ± sd of three replicates. D, Leaves of wild-type and A2AS-3, -7, and -15 plants were treated as in A, and equal amounts of total protein extract (20 μg, controlled by large subunit of Rubisco [Rbc] after Ponceau S staining) were subjected to immunoblot analysis with Hsp17-CI and Hsp101 antibodies.

