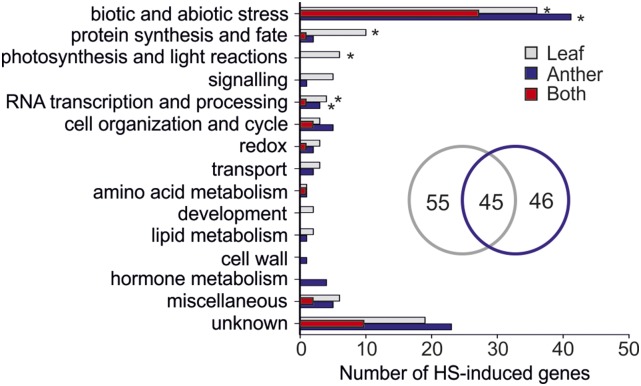
Figure 5.
Classification of HS-induced genes in leaves and anthers of wild-type tomato plants. HS-induced genes (PNOI > 0.95) were categorized based on their putative functions. Each bar shows the total number of genes induced by HS in leaves (gray), anthers (blue), or in both tissues (red). The number of leaf- and anther-specific HS-induced genes are shown in a Venn diagram. Asterisks denote significant enrichment of the particular category in the tissues (P < 0.05) based on comparison against the whole genome.

