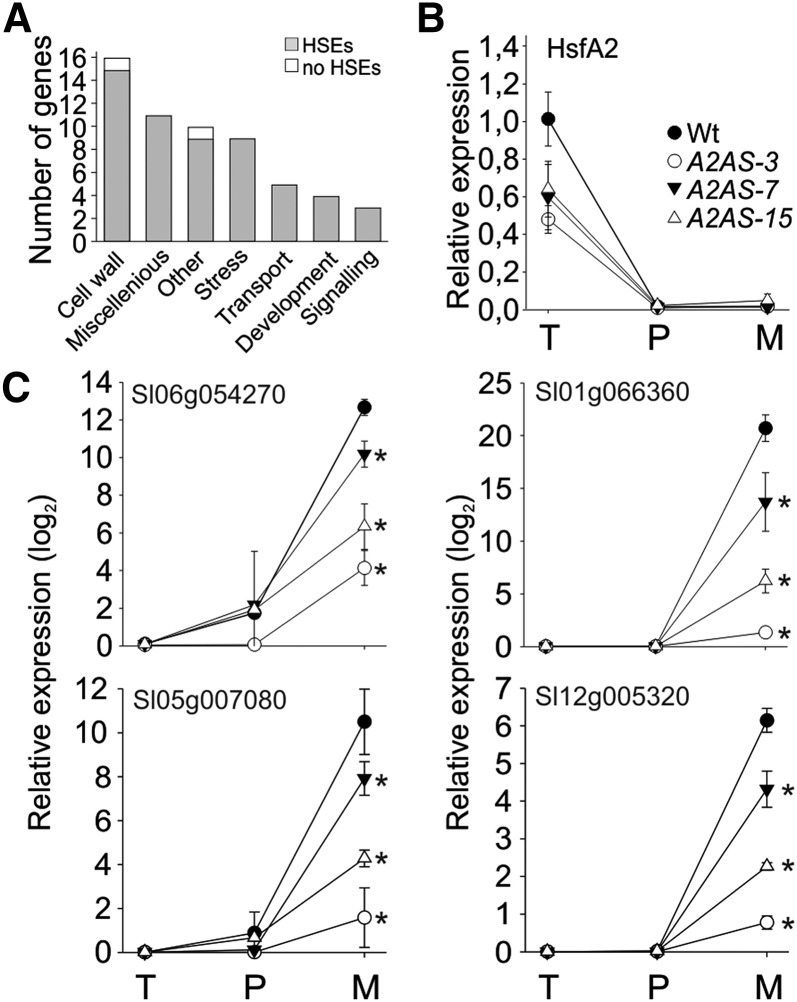
Figure 7.
Genes affected by HsfA2 suppression in nonstressed anthers. A, Genes expressed at significantly higher levels (PNOI > 0.90) in the wild type than A2AS-3 anthers under control conditions as indicated by MACE analysis. Categorization was based on the putative functions of the genes according to MapMan analysis (see “Materials and Methods”). Genes with unknown functions are not shown. The number of genes belonging to each category is shown. Gray bars indicate the number of genes having at least one dimeric or trimeric HSE in their putative promoter regions. B, Relative expression (2–ΔΔCt) of HsfA2 under control conditions in wild-type and A2AS-3 anthers of different developmental stages corresponding to pollen at tetrad (T), postmeiotic microspore (P), and mature pollen (M) stage, respectively. C, Relative expression (2–ΔΔCt) of a solute carrier protein/Glc transporter (Solyc06g054270), a pectinesterase (Solyc01g066360), a pectate lyase (Solyc05g007080), and a pectinacetylesterase (Solyc12g005320) during development of anthers as described in B. In all cases the expression values were normalized against anthers containing pollen at tetrad stage. Each point is the average ± sd of four replicates. Asterisks indicate statistically significant differences (P < 0.05) as indicated by pairwise t test between wild-type and A2AS samples.

