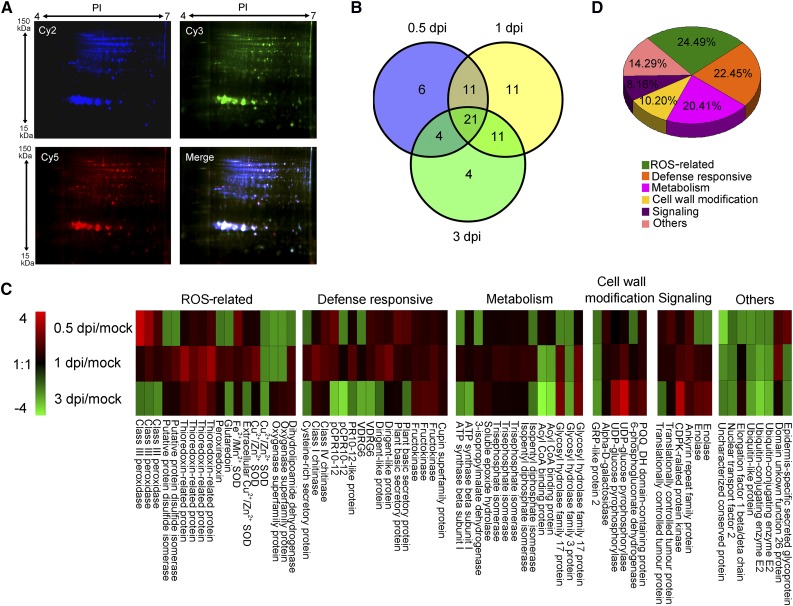
Figure 2.
Analysis of V. dahliae-responsive apoplast secretome in cotton roots. A, DIGE images of apoplastic proteins isolated from mock-inoculated plants (A1, the first repeat of Mock) and plants at 0.5 dpi (B2, the second repeat of 0.5 dpi). Cy2 (blue) image of proteins represents an internal standard containing equal quantities of all samples. Cy3 (green) image of proteins from A1, and Cy5 (red) image of proteins from sample B2. The DIGE experimental design is shown in Supplemental Table S2. All images were observed with the Typhoon FLA9500 imager (GE Healthcare Life Sciences). Molecular masses (kDa) and pI are given on the left and top, respectively. B, Venn diagram of abundance changed protein spots in the cotton roots upon V. dahliae infection. The number of differentially expressed protein spots for each specific time point is shown in each different section. C, Expression profiling of differentially expressed protein spots based on their relative in-gel intensities. The average ratios of the fold changes are listed in Supplemental Table S1. The heat map was generated with Multi Experiment Viewer v. 4.9 (http://www.tm4.org/mev.html). Red represents upregulated protein spots; green represents down-regulated protein spots; black represents protein spots that remain the same under different conditions. D, Functional classification of differently expressed proteins using the Gene Ontology Tool (http://www.geneontology.org).

