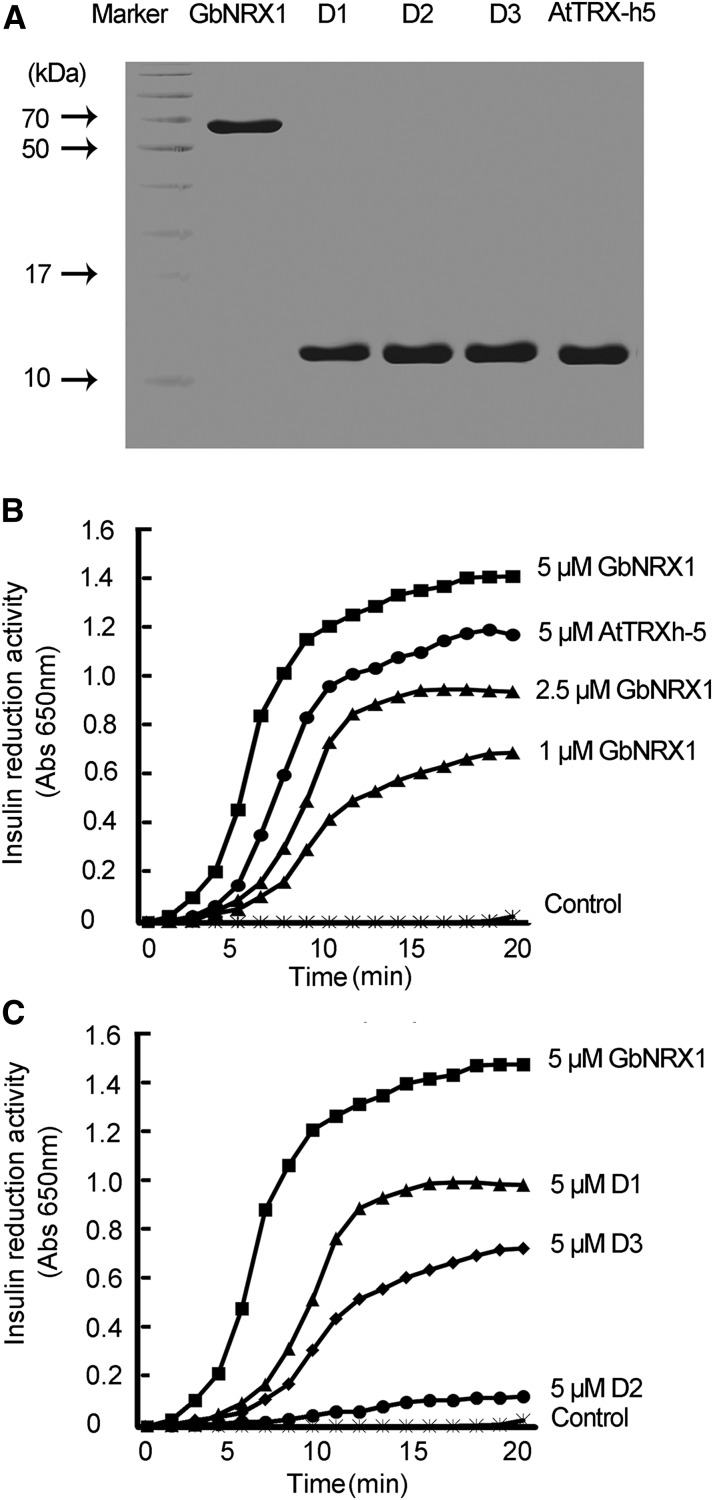
Figure 6.
Analysis of insulin disulfide reductase activity of GbNRX1. A, SDS-PAGE analysis of purified proteins. GbNRX1, D1 (domain 1), D2 (domain 2), D3 (domain 3), and AtTRX-h5 were expressed in E. coli, and the purified proteins were subjected to SDS-PAGE. Molecular masses (in kDa) are given on the left. B, Insulin reduction assay. Purified GbNRX1 (5, 2.5, and 1 µM) and AtTRX-h5 (5 µM) were used for the insulin reduction assay, and enzyme activity was quantified based on A650. C, Time course of insulin disulfide reductase activity. Five micromolars of intact GbNRX1, D1 (domain 1), D2 (domain 2), and D3 (domain 3) was used and reaction buffer was used as a negative control.

