
Fig. 5. Local and systemic sensitivity to doxorubicin in three human tumor models.
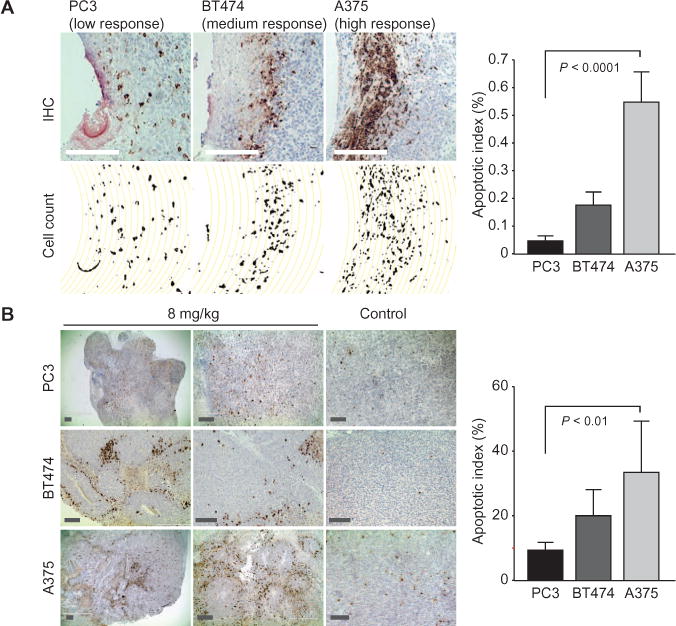
(A) Differential response of three human cell line tumor models to pure doxorubicin as measured by CC3+ cells. Data are averages ± SD (n = 18 to 22 unique reservoirs from 12 tumors for each model). Scale bars, 250 μm. (B) Apoptosis induction (CC3+ cells) after systemic administration of doxorubicin in A375, BT474, and PC3 tumors. Representative sections of tumors are shown 24 hours after treatment with doxorubicin (8 mg/kg) or control (saline injection). Data are averages ± SD CC3 expression from 12 sections scored per tumor model (4 sections each from three tumors for each model), and were scored in a blinded manner. Scale bars, 250 μm.