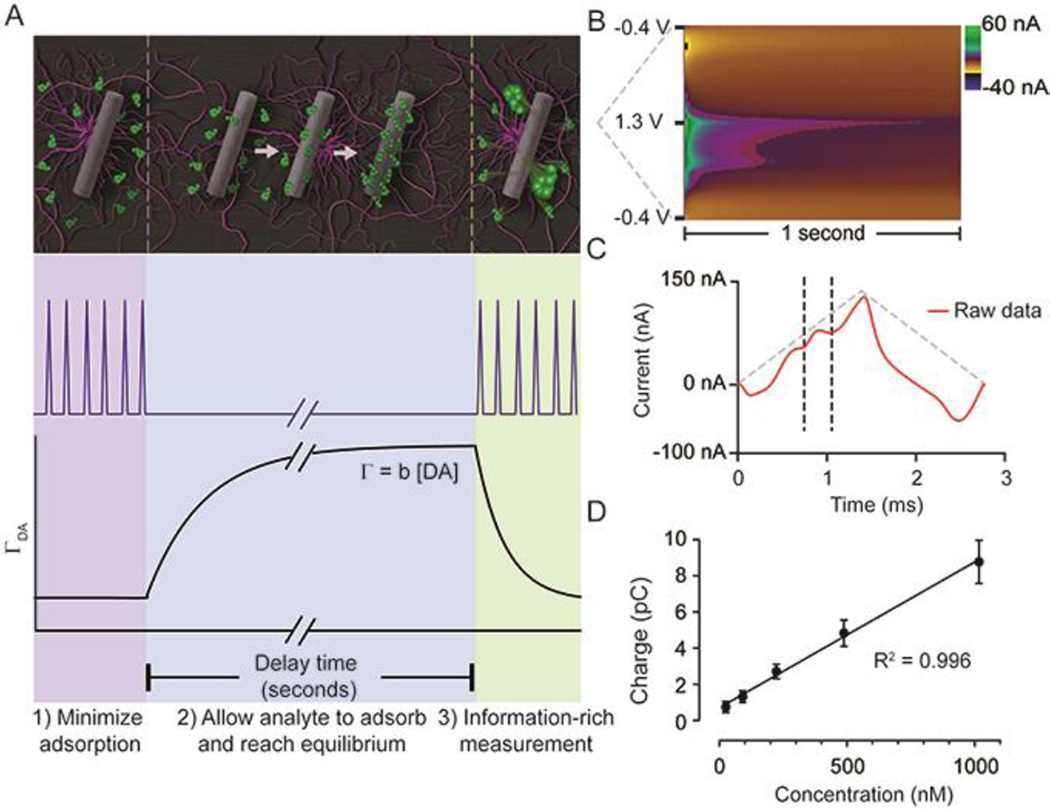
Fig. 1.
FSCAV was carried out in 3 steps (A): 1) The waveform was applied every 10 ms which minimizes dopamine adsorption to the electrode. 2) The potential was held at −0.4 V for 10 seconds to allow dopamine to adsorb to the electrode and reach equilibrium. 3) The waveform was reapplied, and the adsorbed dopamine was measured. Surface-accumulated dopamine (ΓDA) is proportional to the tonic concentration [DA] by the strength of adsorption (b). (B) Resultant color plot from step 3, with voltage on the ordinate, time on the abscissa, and current displayed using false colors. (D) Representative current trace (red) taken 10 ms after the beginning of step 3. The vertical dashed lines show the bounds for integration to quantify adsorbed dopamine. The grey-dashed triangles illustrate the voltage waveform applied. (D) A calibration plot obtained by FSCAV post implantation (R2 = 0.996, slope = 0.0078 ± 0.0002 pC/nM (n = 7 electrodes), which when accounting for electrode area and equivalents transferred, corresponds to b = 0.0037 ± 0.0002 cm.

