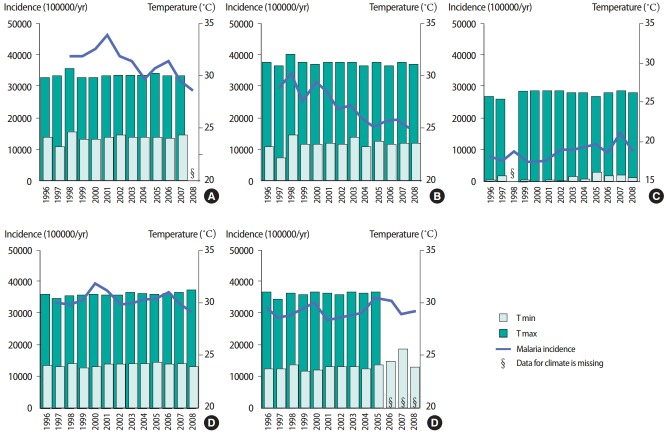
Figure 5.
Changes in annual malaria incidence and monthly average of daily maximum (T max) and minimum (T max) temperature (A) Western Province, southern coastal region, (B) National Capital District, southern coastal region, (C) Eastern Highland Province, highland region, (D) East Sepik Province, northern coastal region, and (E) Madang Province, northern coastal region, during 1996-2008. X-axis: year, Y-axis: left, annual malaria incidence per 100000/yr (outpatients), right, temperature (°C).

