Figure 1.

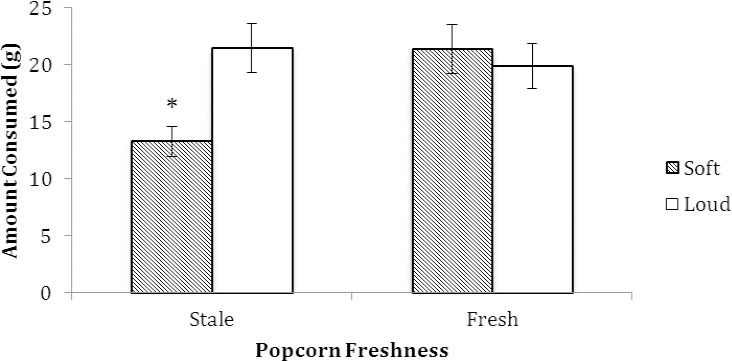
Total amount consumed (g) of fresh and stale popcorn in the soft and loud volume groups in Experiment 1. An asterisk indicates significance at p = .01. Vertical bars indicate standard error of the mean (SEM)

Total amount consumed (g) of fresh and stale popcorn in the soft and loud volume groups in Experiment 1. An asterisk indicates significance at p = .01. Vertical bars indicate standard error of the mean (SEM)