Figure 2.

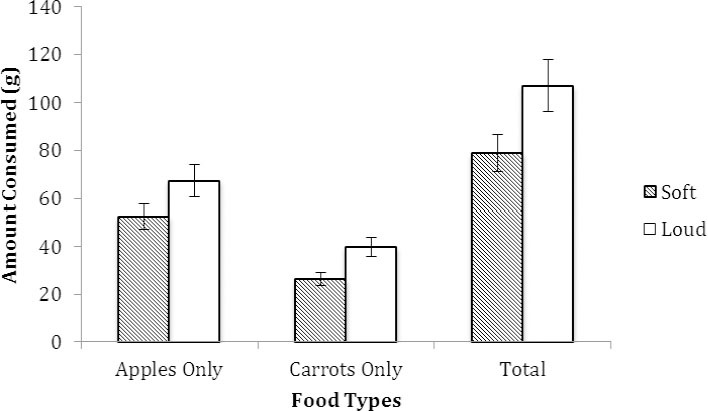
Total amount consumed (g) of apples, carrots, and total intake in the soft and loud volume groups in Experiment 2. For each food type, significantly more food was consumed in the loud vs. soft volume groups. Vertical bars indicate SEM

Total amount consumed (g) of apples, carrots, and total intake in the soft and loud volume groups in Experiment 2. For each food type, significantly more food was consumed in the loud vs. soft volume groups. Vertical bars indicate SEM