
Figure 3.
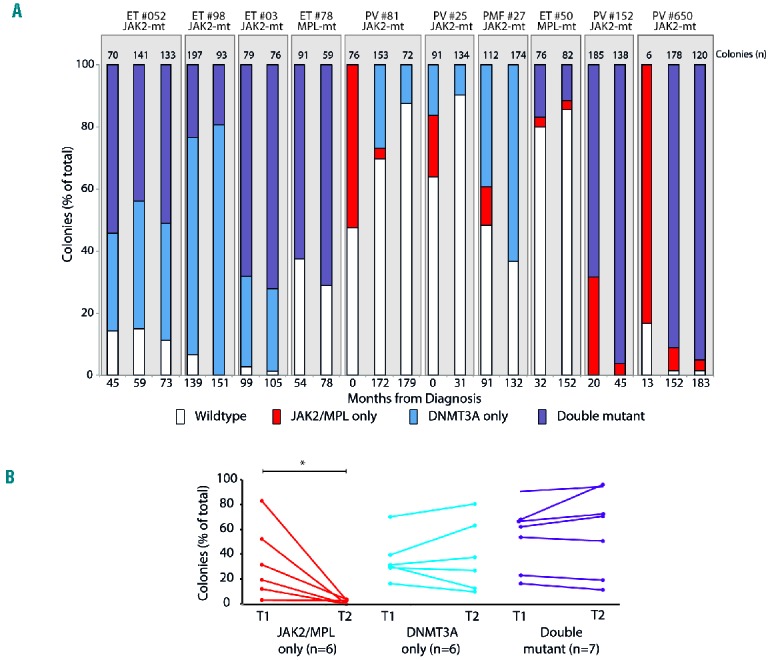
Evolution of subclones in DNMT3A-mutated MPN. (A) Colonies grown from paired samples obtained at different time-points (median separation 35 months; range, 6–179 months) in ten patients. Vertical axis shows the percentage of total colonies and columns are shaded to represent the proportions of the different genotypes (red, JAK2/MPL-only; blue, DNMT3A-only; purple, double mutant). Numbers of colonies genotyped per patient are shown above columns and the timings of sample acquisition (months from diagnosis) are shown below. (B) Changes in subclonal proportions over time for the ten patients in (A) for a total of 19 subclones. red, JAK2/MPL-only; blue, DNMT3A-only; purple, double mutant; T1 and T2 represent the earliest and latest time-points sampled for the patients. The median interval between T1 and T2 did not differ significantly between the different subclones (one-way analysis of variance). * <0.05 Wilcoxon ranked sum test.