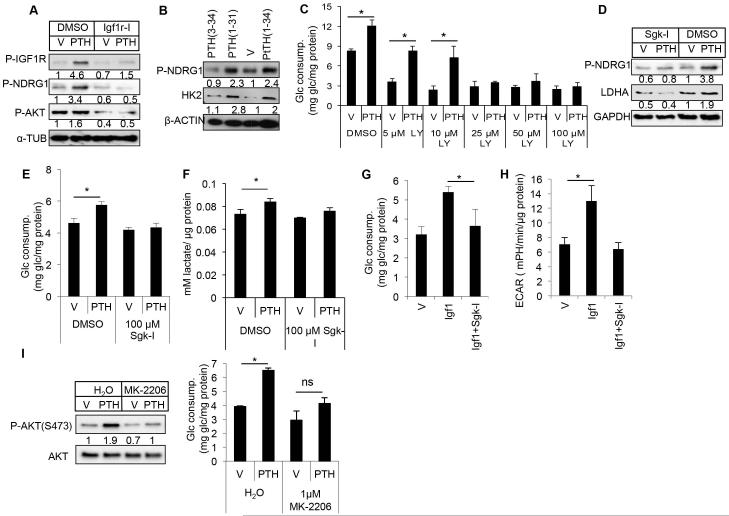
Fig. 5.
PTH stimulates glycolysis through Igf-Sgk1 signaling. (A) Effect of Linsitinib (Igf1r-I, 100 nM) on mTORC2 signaling in MC3T3-E1 cells in response to PTH (500 ng/mL) for 48 hours. (B) Western blot analyses of Sgk1 activation and HK2 accumulation in MC3T3-E1 cells treated with various PTH fragments (250 ng/mL) for 48 hours. (C) Effect of PI3K inhibitor LY294002 (LY) on glucose consumption by MC3T3-E1 cells treated with vehicle (V) or PTH (500 ng/mL) for 48 hours. (D–F) Effects of 100 μM Sgk1 inhibitor GSK650394 (Sgk-I) on MC3T3-E1 cells treated with vehicle (V) or PTH (500 ng/mL) for 48 hours. Protein abundance normalized to GAPDH in D. (G) Glucose consumption by MC3T3-E1 cells treated with vehicle (V), Igf1 (500 ng/mL) and GSK650394 (100 μM, Sgk-I) for 48 hours. (H) Measurements of ECAR in differentiated MC3T3-E1 cells treated for 6 hours. (I) Effect of AKT inhibitor MK2206 (MK) (1 μM) on P-AKT (S473) and glucose consumption by MC3T3-E1 cells treated with vehicle (V) or PTH (500 ng/mL) for 48 hours. P-AKT normalized to total AKT. *p < 0.05, n = 3. Error bars = SD. V = vehicle; Glc = glucose; LY = LY294002; ECAR = extracellular acidification rate.

