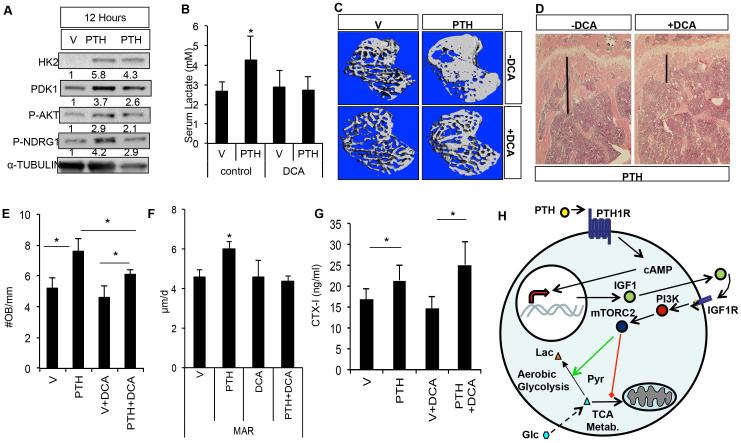
Fig. 6.
Aerobic glycolysis contributes to the anabolic effect of PTH in vivo. (A) Western blot analyses of bone protein extracts from mice treated with vehicle (V) or PTH (200 μg/kg) for 12 hours. Samples from two PTH-treated mice are shown. Protein abundance normalized to α-tubulin. (B) Serum lactate levels in mice administered vehicle (V) or PTH with or without DCA for 1 month. (C, D) Effect of PTH and DCA on trabecular bone of the proximal tibia, as analyzed by μCT (C) or histology (D). Black line denotes height of trabecular bone region. (E) Quantification of osteoblast numbers. (F) Quantification of MAR. (G) Serum CTX-I (ng/mL) levels. n = 3. (H) Model for PTH to reprogram glucose metabolism via Igf signaling. In addition to transcriptional upregulation of Igf1, PTH may also employ other mechanisms to activate Igf signaling (see Discussion). Green arrow = stimulation; red line = suppression. Dotted arrow symbolizes multiple steps of glycolysis. Lac = lactate; Pyr = pyruvate; Glc = glucose; V = vehicle; MAR = mineral apposition rate; DCA = dichloroacetate; OB = osteoblast; TCA = tricarboxylic acid; mTORC2 = mammalian target of rapamycin complex 2.

