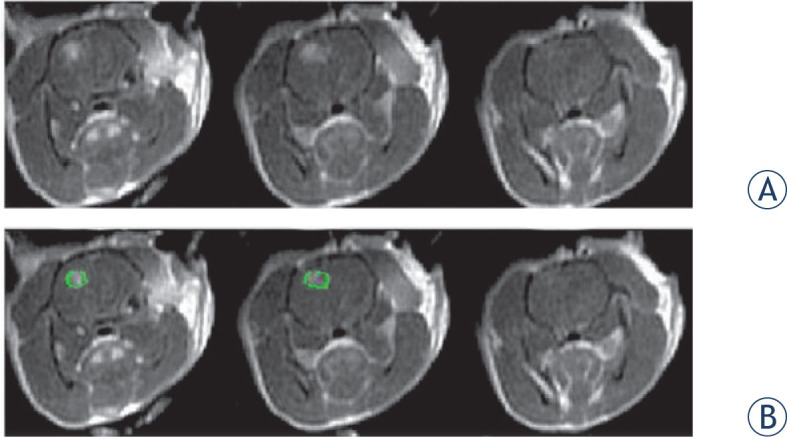
Figure 2.

MRI example. (A) 3 slices of contrast-enhanced T1-weighted MR images of a rat treated with 45 electroporation pulses. The MR images was obtained 30 min post treatment. Each slice is 2mm thick. The enhancing region represents BBB disruption. (B) ROI (green) plotted in the MR image to mark the enhancing region.
