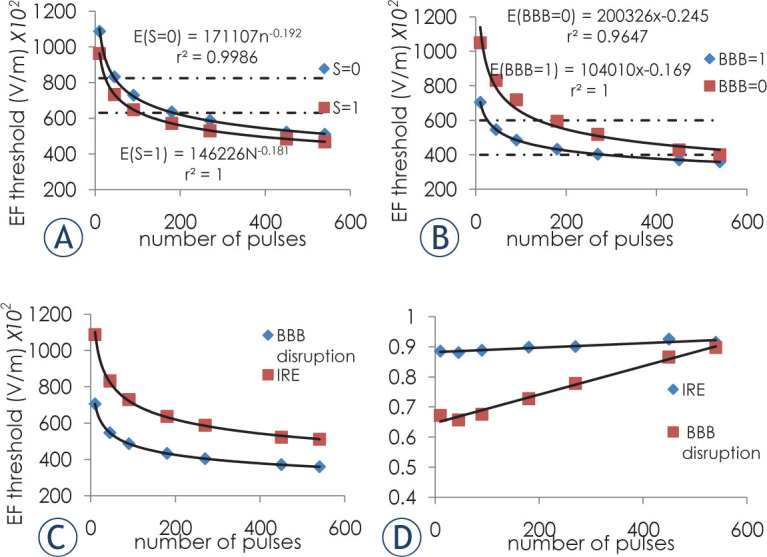
Figure 6.

Electrical field thresholds. (A) IRE thresholds. Dashed line represents published IRE thresholds for white matter for 80 50 μ s pulses at 4 Hz. (B) BBB disruption thresholds. Dashed line represent previously published threshold for 90 50 μ s pulses at 4 Hz.5 (C) Thresholds for E(S = 0) for the IRE and E(S = 1) for BBB disruption. (D) Ratio between E(S = 1) and E(S = 0) for IRE and E(BBB = 0) and E(BBB = 1 ) for BBB disruption. Error bars are smaller than markers.
