
Figure 1.
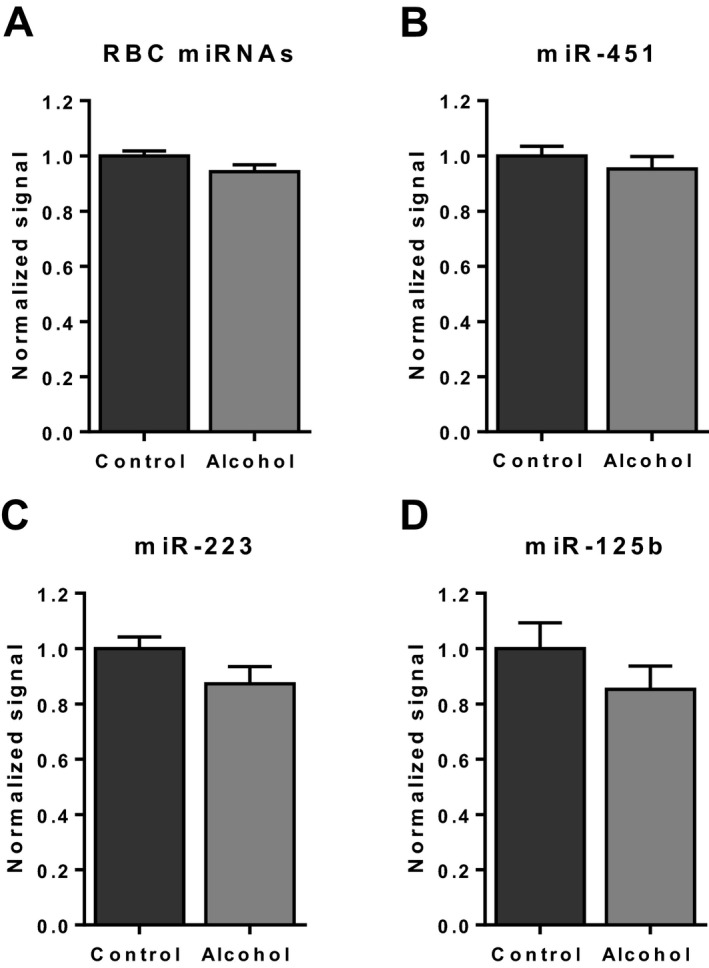
Red blood cell (RBC) and white blood cell (WBC) microRNA (miRNA) levels in serum. Relative levels of RBC miRNAs (miR‐451, miR‐486‐5p, miR‐92a, let‐7a, and miR‐16) (A), and in particular miR‐451 (B), showed no difference between groups, indicating that hemolysis did not affect the results. There was also no difference between groups for WBC miRNAs, miR‐223 (C) and miR‐125b (D). Data represent microarray signal intensities normalized to the average values of the control group (mean ± SEM).