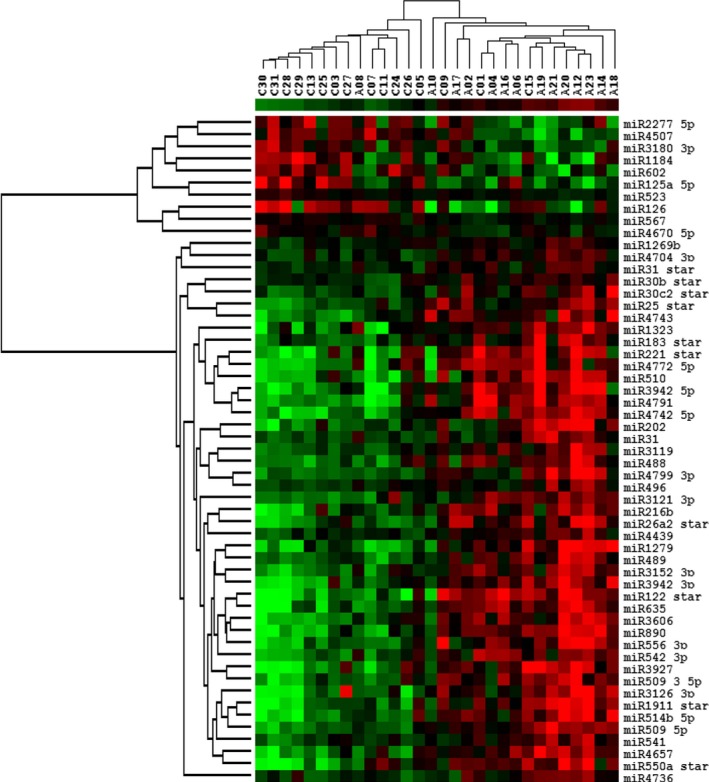
Figure 3.

Hierarchical clustering of subjects and microRNAs (miRNAs). The levels of 55 serum miRNAs that passed false discovery rate‐corrected ANCOVAs (α = 0.05) were used for analyses of the 30 subjects. An “A” followed by a number designates all the alcohol‐consuming subjects, while a “C” designates control subjects. Subjects were clustered into 2 groups with most alcohol‐consuming and control individuals present in separate clusters. miRNAs were clustered into 2 groups, those that were increased in the alcohol group and those that were decreased in this group.
