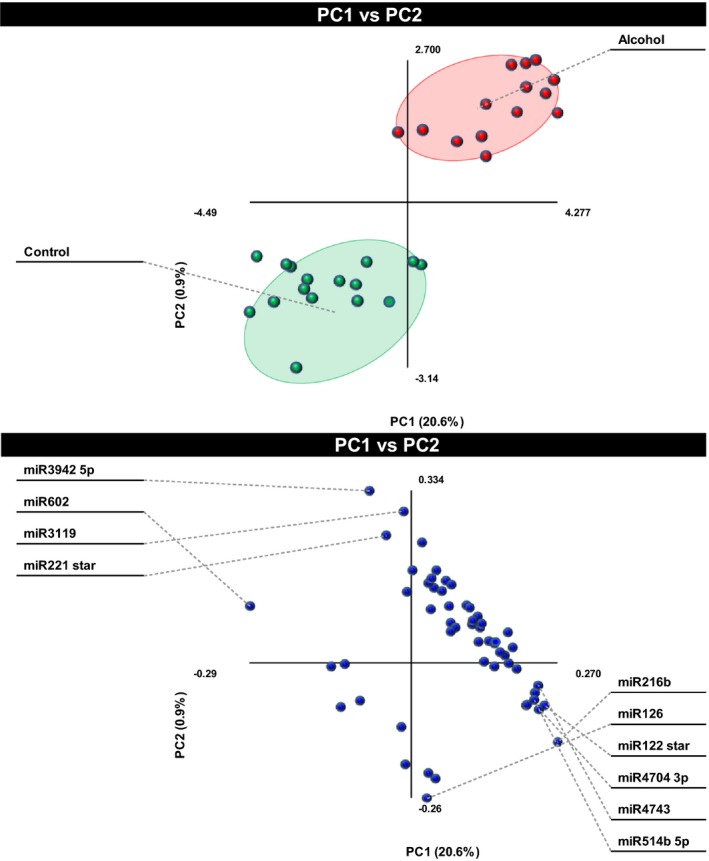
Figure 4.

Identification of the top 10 most discriminant microRNAs (miRNAs). The 55 significantly altered miRNAs were subjected to orthogonal partial least‐squares discriminant analysis to determine which miRNAs contributed most to the segregation of the 2 groups. The top panel shows the separation of subjects according to the alcohol consumption. The top 10 contributors are labeled in the bottom panel.
