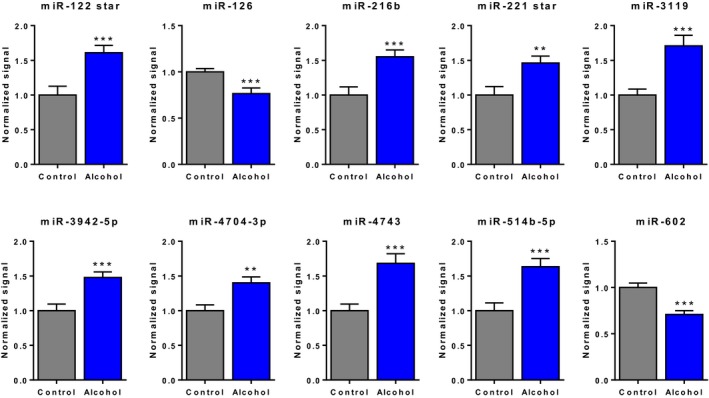
Figure 5.

Bar graphs illustrating the difference between alcohols and controls for the top 10 discriminating microRNAs (miRNAs) identified by discriminant analysis. Data represent batch‐corrected and log2‐normalized microarray signal intensities (mean ± SEM). **p < 0.01, ***p < 0.001.
