
Figure 7.
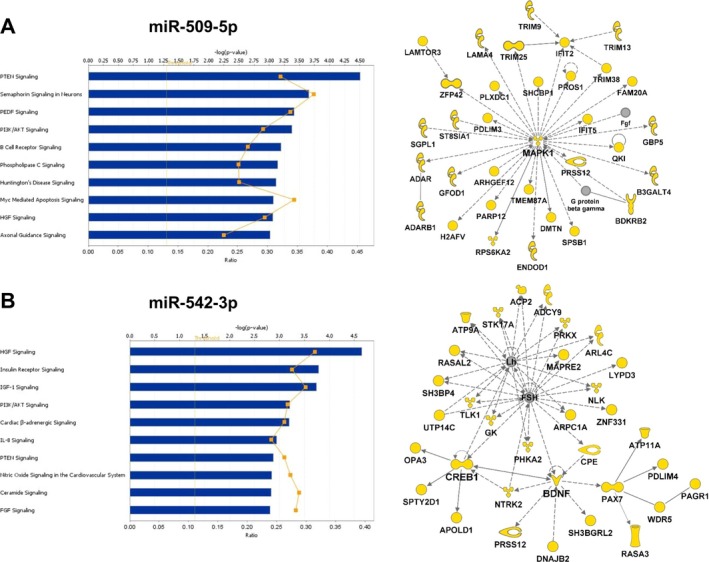
Ingenuity Pathway Analysis canonical pathways and functional networks for putative targets of miR‐509‐5p (A) and miR‐542‐3p (B). The top 10 canonical pathways are shown. Threshold was set at p < 0.05. Molecules in yellow are predicted targets. Solid and dashed lines denote direct and indirect interactions, respectively.