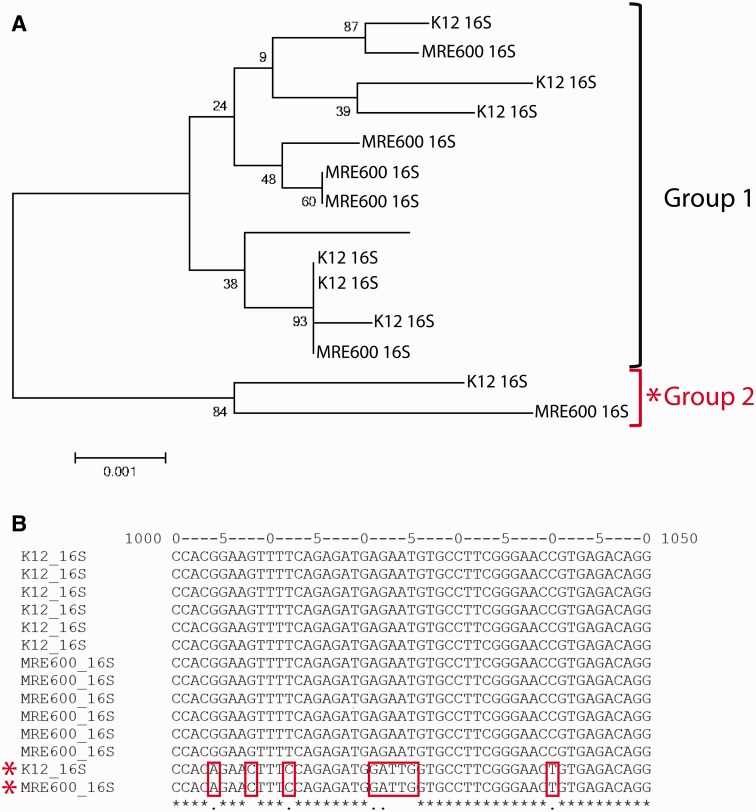
Fig. 5.—
The relationship between MRE600 and E. coli K12 16S rRNAs. (A) Phylogenetic tree showing the relationship between MRE600 and E. coli K12 16S rRNAs. Two groups of rRNAs were identified, which we named “Group 1” and “Group 2.” These relationships were inferred using the Neighbor-Joining method (Saitou and Nei 1987). The percentage of replicate trees in which the associated sequences clustered together in the bootstrap test (1,000 replicates) is shown next to the branches (Felsenstein 1985). The tree is drawn to scale, with branch lengths in the same units as those of the evolutionary distances used to infer the phylogenetic tree. The evolutionary distances were computed using the Maximum Composite Likelihood method (Tamura et al. 2004) and are in the units of the number of base substitutions per site. The analysis involved 14 sequences (1,543 positions each), and all positions containing gaps and missing data were eliminated. Evolutionary analyses were conducted in MEGA6 (Tamura et al. 2013). (B) The two groups of 16S rRNAs are identified by distinct sequences in the region encompassing nucleotides 1000–1050. This multiple sequence alignment was generated using MAFFT (Katoh and Standley 2013).

